Fig. 5
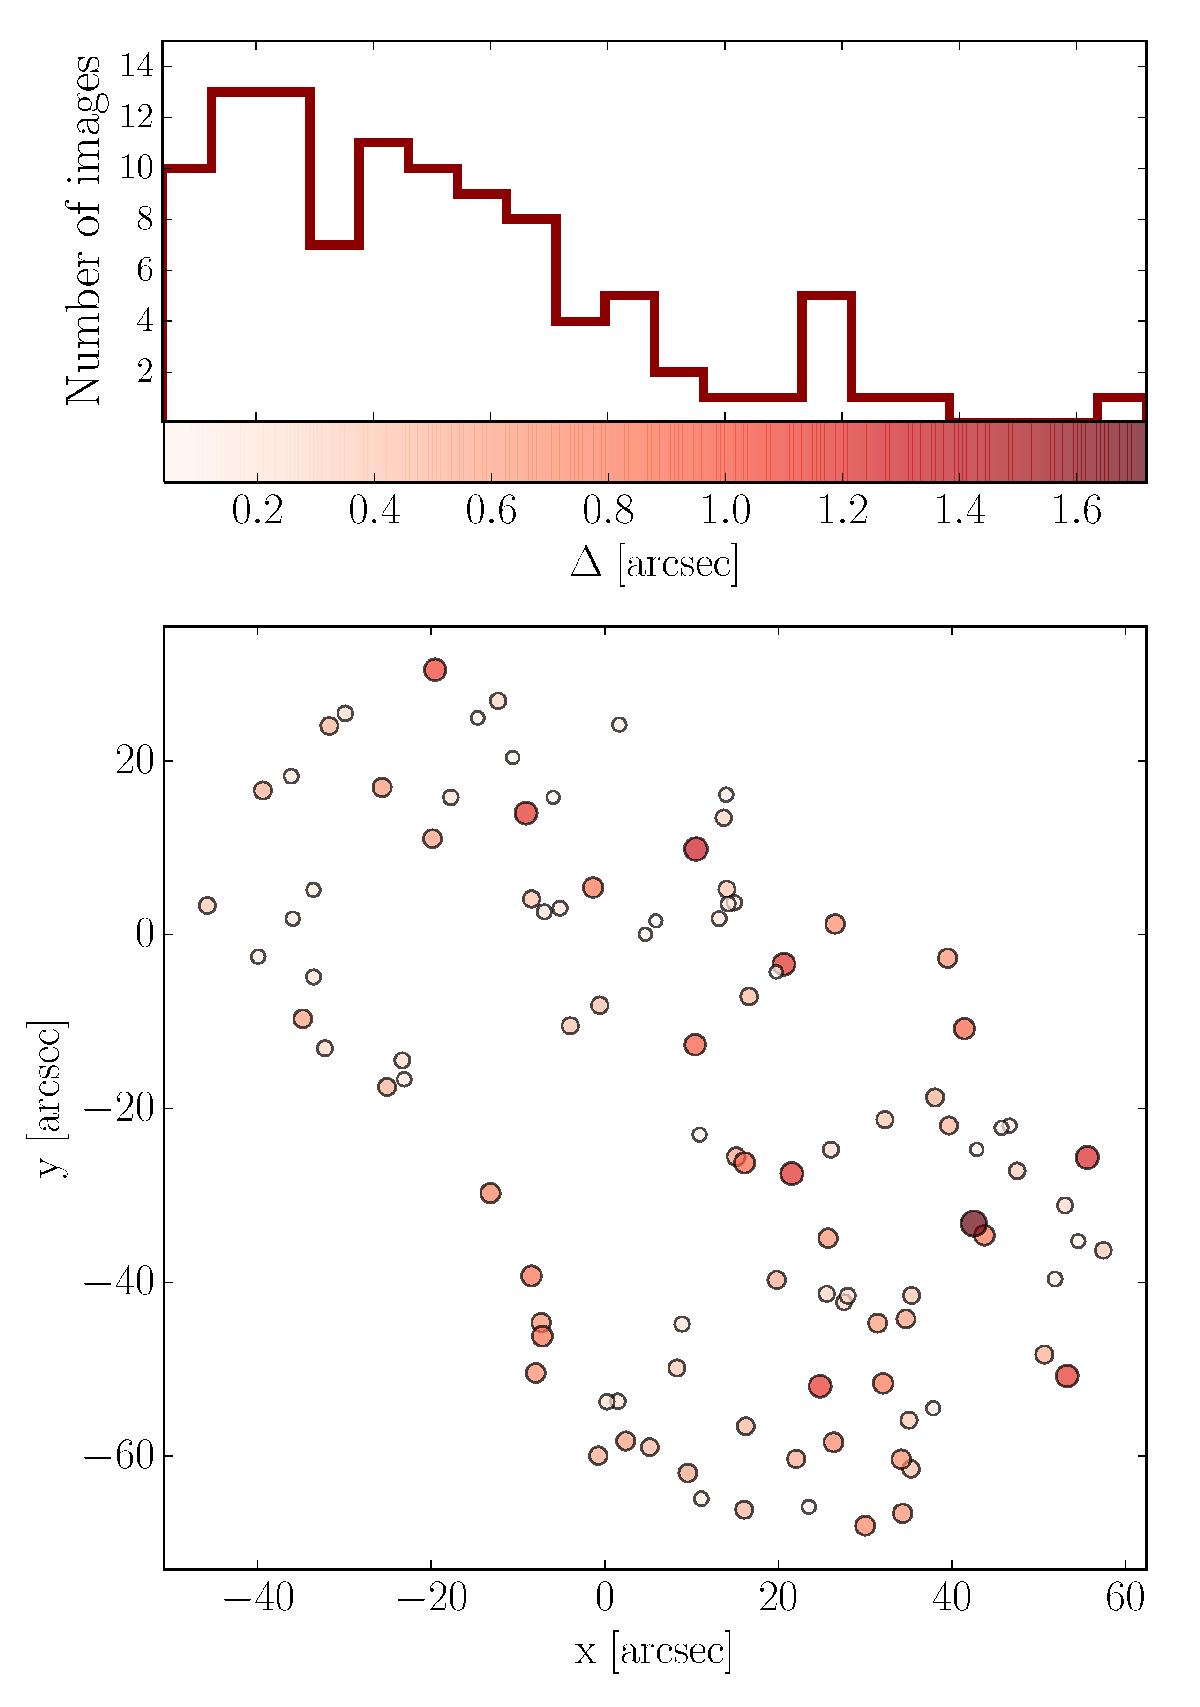
Top panel: distribution of the absolute value of the offsets Δ between the observed and predicted (from our best-fitting model) positions of the multiple images. Bottom map: spatial distribution of these offsets. The circles indicate the positions of the observed multiple images (relatively to the northern BCG), with colors and sizes scaling with their positional offsets.
Current usage metrics show cumulative count of Article Views (full-text article views including HTML views, PDF and ePub downloads, according to the available data) and Abstracts Views on Vision4Press platform.
Data correspond to usage on the plateform after 2015. The current usage metrics is available 48-96 hours after online publication and is updated daily on week days.
Initial download of the metrics may take a while.