Fig. 9
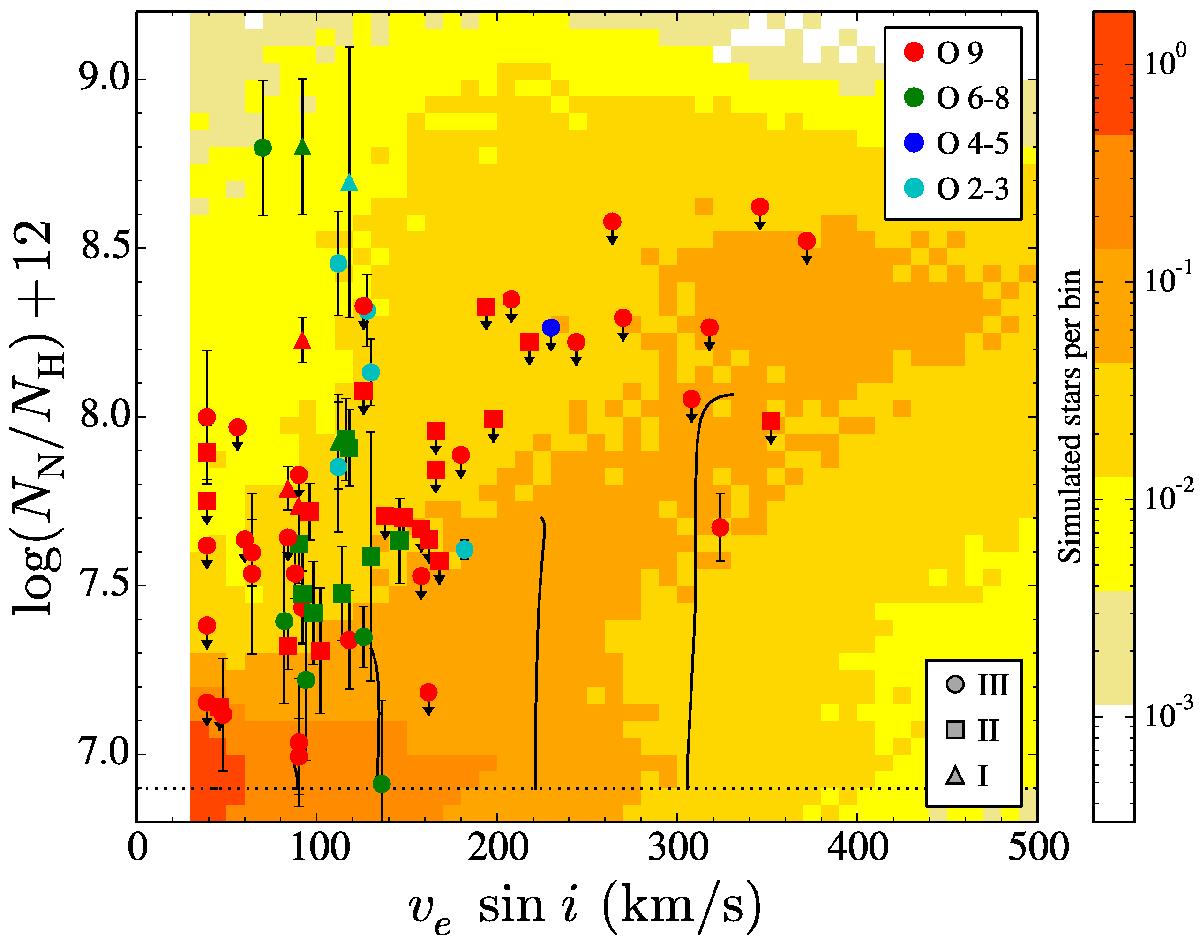
Nitrogen abundance versus projected rotational velocity for the full sample. Symbols indicate luminosity class, colours indicate spectral subtype. Tracks (Brott et al. 2011a) drawn in solid black lines are for a 20 M⊙ star, evolved until the effective temperature is below 29 kK and they become B-type stars. Initial rotational velocities for the tracks are 114, 170, 282 and 390 kms-1 and have been multiplied by π/ 4 to account for the average projection effect. The population synthesis calculation projected in the background is for the O star phase only and assumes a flat distribution of rotational velocities. Out of 740 × 103 simulated stars, 310 × 103 pass the selection criterion (Teff ≥ 29 kK). These are normalised to 72 stars, matching the number of observed stars in the plot.
Current usage metrics show cumulative count of Article Views (full-text article views including HTML views, PDF and ePub downloads, according to the available data) and Abstracts Views on Vision4Press platform.
Data correspond to usage on the plateform after 2015. The current usage metrics is available 48-96 hours after online publication and is updated daily on week days.
Initial download of the metrics may take a while.