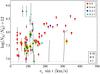
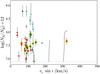
Fig. 8
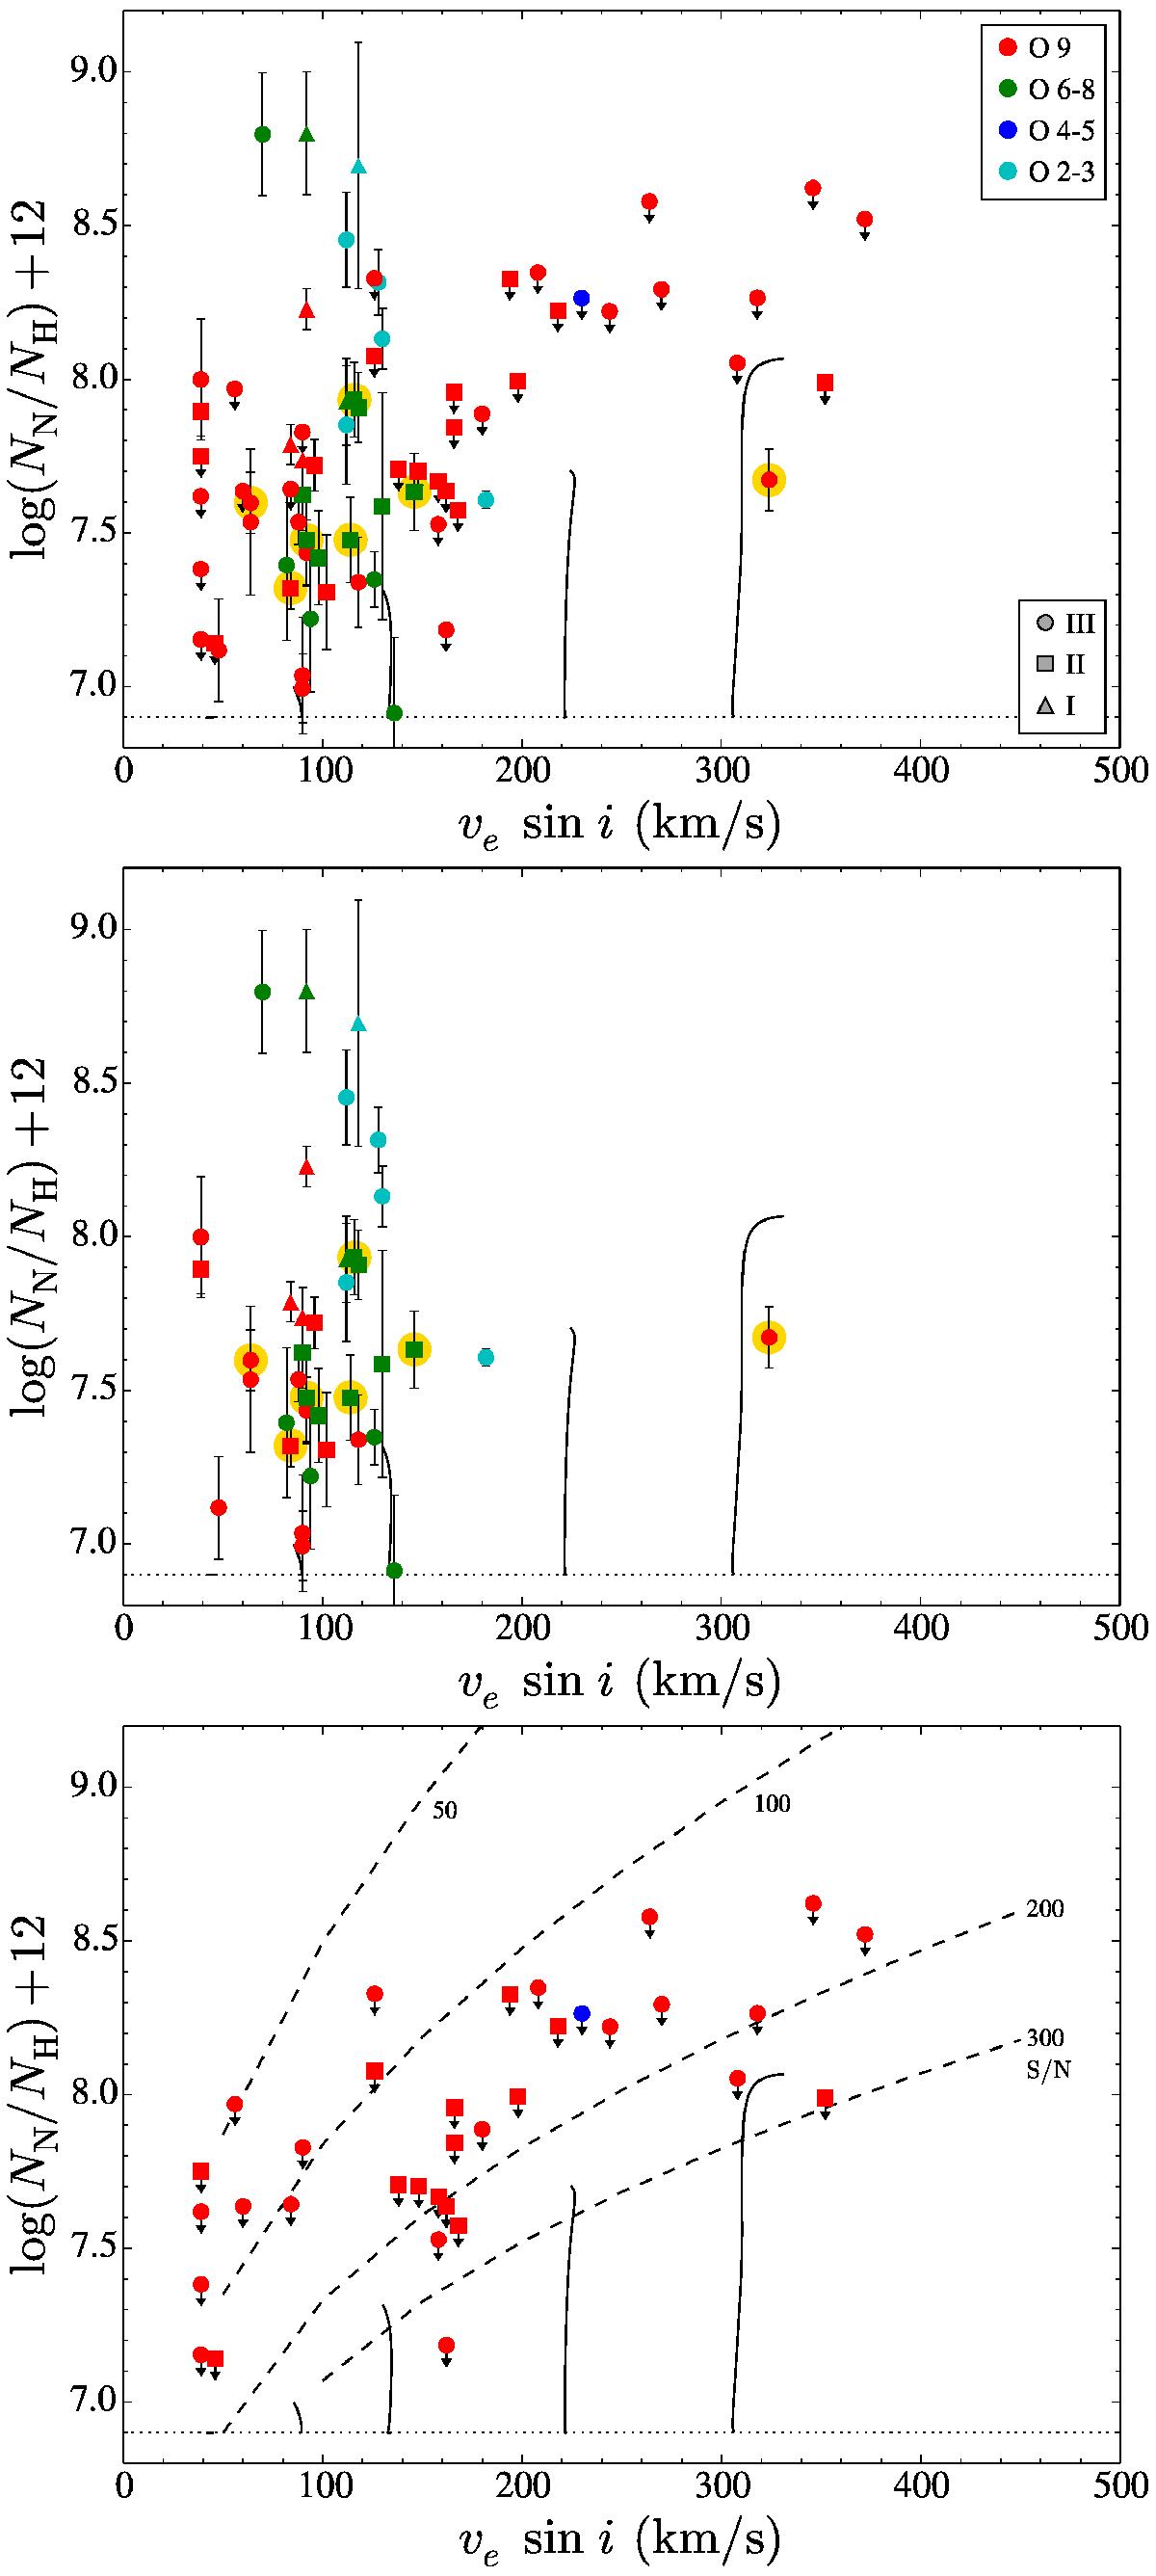
Nitrogen abundance versus projected rotational velocity. For all panels, symbols denote luminosity class and colours spectral type; see legend in the top panel. Top panel: entire sample. The newly detected binaries have a yellow circle underlaid (see Sect. 3.4). Middle panel: subset of stars for which the nitrogen abundance could be measured. Bottom panel: subset of stars for which only upper limits could be derived. The dashed lines indicate detection limits for different S/N and are discussed in Sect. 4. The black solid lines are evolutionary tracks for the O-type stage (Teff ≥ 29 kK) of a 20 M⊙ star (Brott et al. 2011a), with initial rotational velocities of 114, 170, 282 and 390 kms-1. We multiply the rotational velocity of these tracks by π/ 4 to account for the average projection effect.
Current usage metrics show cumulative count of Article Views (full-text article views including HTML views, PDF and ePub downloads, according to the available data) and Abstracts Views on Vision4Press platform.
Data correspond to usage on the plateform after 2015. The current usage metrics is available 48-96 hours after online publication and is updated daily on week days.
Initial download of the metrics may take a while.