Fig. 6
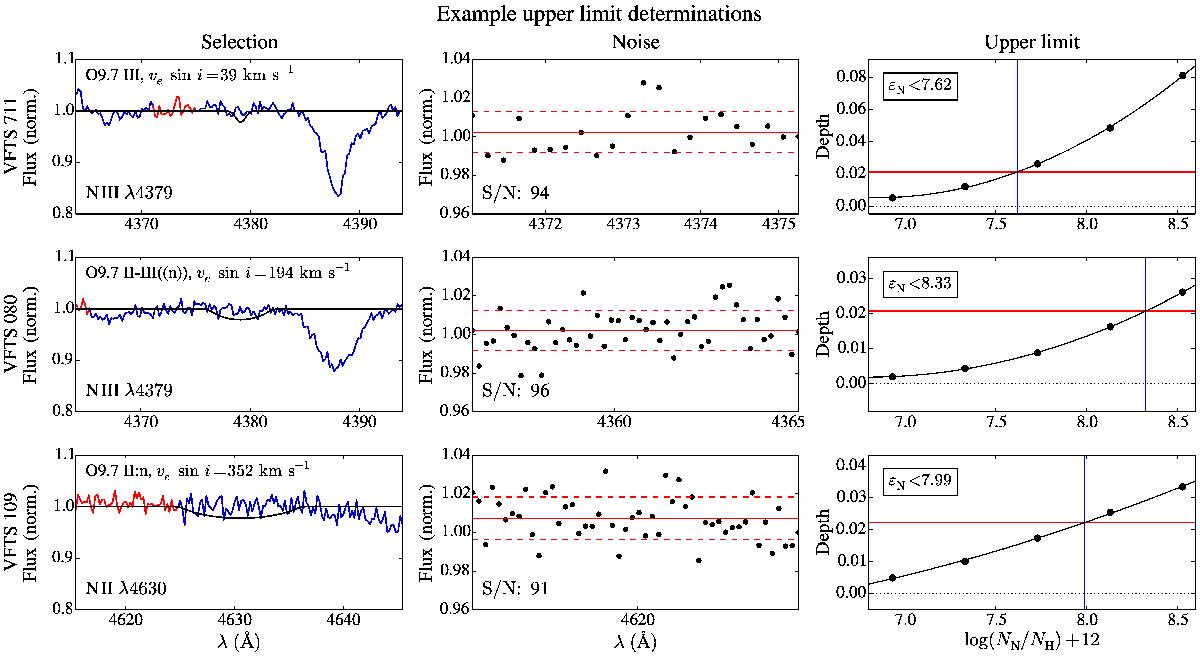
VFTS 711, 080, and 109 are examples of cases for which only upper limits could be derived. Left panels: the observed spectrum is shown in blue, the region used to determine the S/N in red, and the model representing the upper limit in black. Middle panels: zoom in on the fitted region. For these cases this region is used to determine the S/N. The red line is the mean flux level of this range; the dashed lines indicate the standard deviation. Right panels: theoretical depth values as a function of εN in black, where the minimal detectable depth and its inferred upper limit are indicated as the red horizontal and the blue vertical line respectively. The resulting upper limit is indicated in the top left corner of the right panel. The line depression for the upper limit to εN can be considerably larger than the noise would suggest as a result of our conservative choice for this limit (see Sect. 3.3).
Current usage metrics show cumulative count of Article Views (full-text article views including HTML views, PDF and ePub downloads, according to the available data) and Abstracts Views on Vision4Press platform.
Data correspond to usage on the plateform after 2015. The current usage metrics is available 48-96 hours after online publication and is updated daily on week days.
Initial download of the metrics may take a while.