Fig. 5
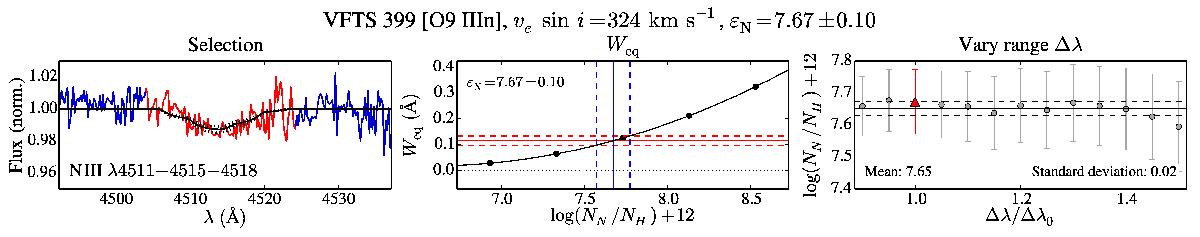
Example of a Weq measurement by integration (for VFTS 399). The Weq is extracted by integration of the red region of the spectrum in the left panel. In the middle panel, this is compared to theoretical Weq values of the combined complex as predicted by FASTWIND, yielding εN and its associated error. The robustness of the measurement is checked twofold: first by comparing a model with the final solution to the observed spectrum (left panel, solid black line). Second, in the right panel, by comparing the abundance measurements that result from adjustment of the integration bounds, varying the width Δλ as function of the adopted width Δλ0, where the adopted measurement is indicated by the red triangle. The 1σ error on Weq is calculated through propagation of the error spectrum.
Current usage metrics show cumulative count of Article Views (full-text article views including HTML views, PDF and ePub downloads, according to the available data) and Abstracts Views on Vision4Press platform.
Data correspond to usage on the plateform after 2015. The current usage metrics is available 48-96 hours after online publication and is updated daily on week days.
Initial download of the metrics may take a while.