Fig. 2
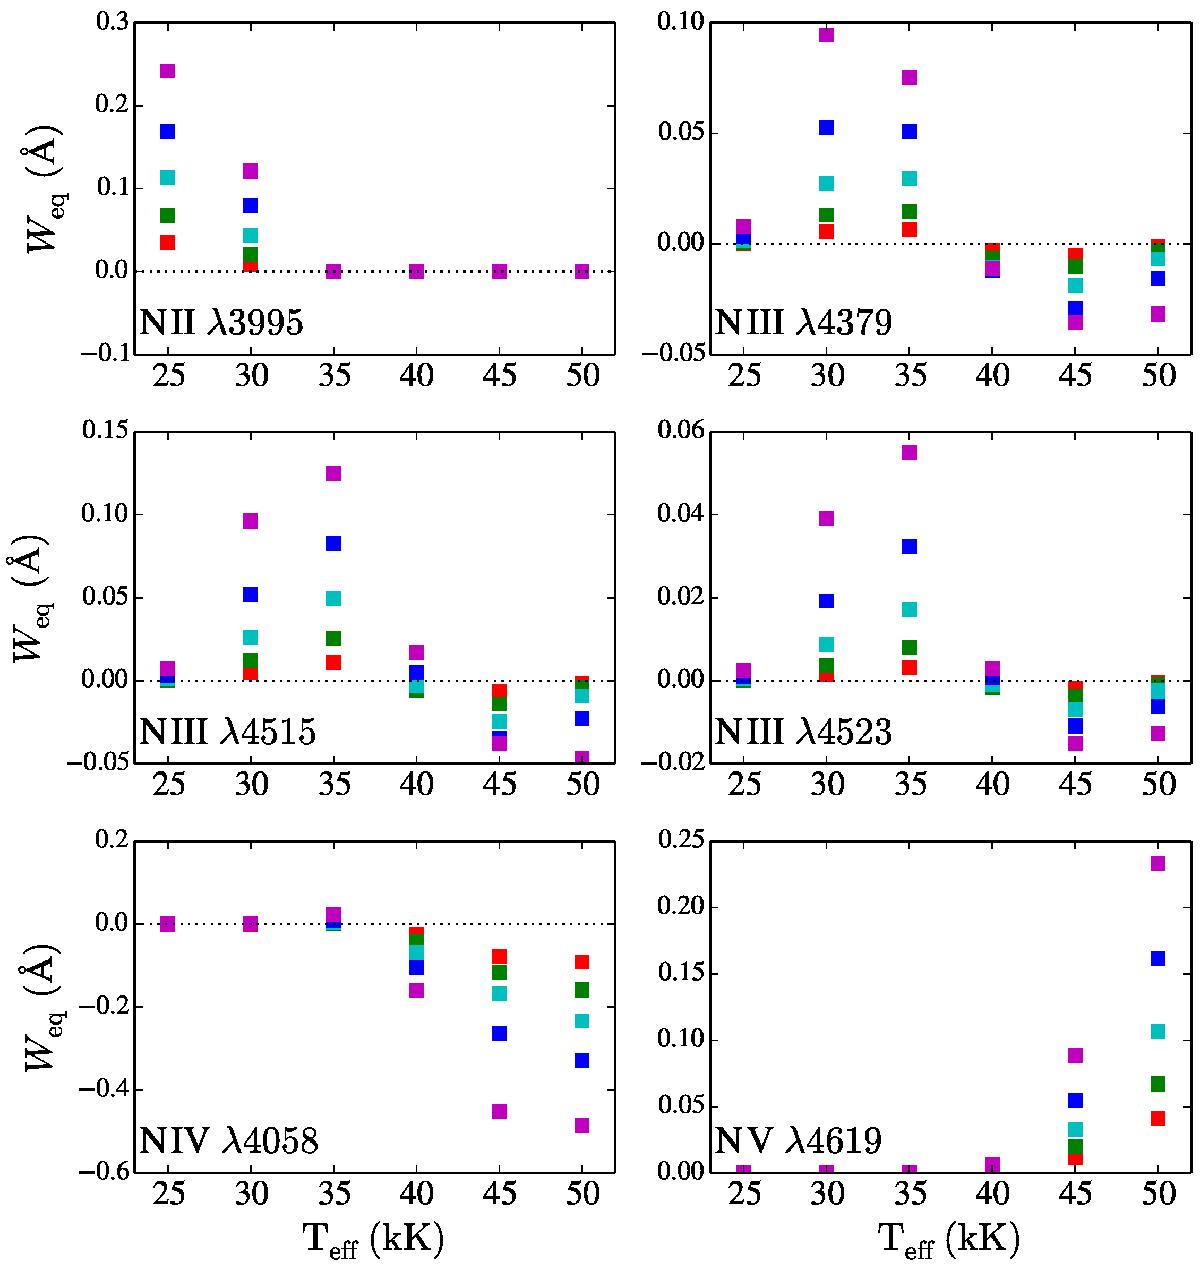
Equivalent width as a function of effective temperature and nitrogen abundance for several diagnostic lines. Colours, following the rainbow from red to purple, indicate nitrogen abundances εN ranging from 6.93 to 8.53 in steps of 0.4 dex. Negative values of Weq represent emission. For all models: log g = 3.9 (cgs), log Ṁ = −6 (M⊙/ yr) and ξm = 7 kms-1.
Current usage metrics show cumulative count of Article Views (full-text article views including HTML views, PDF and ePub downloads, according to the available data) and Abstracts Views on Vision4Press platform.
Data correspond to usage on the plateform after 2015. The current usage metrics is available 48-96 hours after online publication and is updated daily on week days.
Initial download of the metrics may take a while.