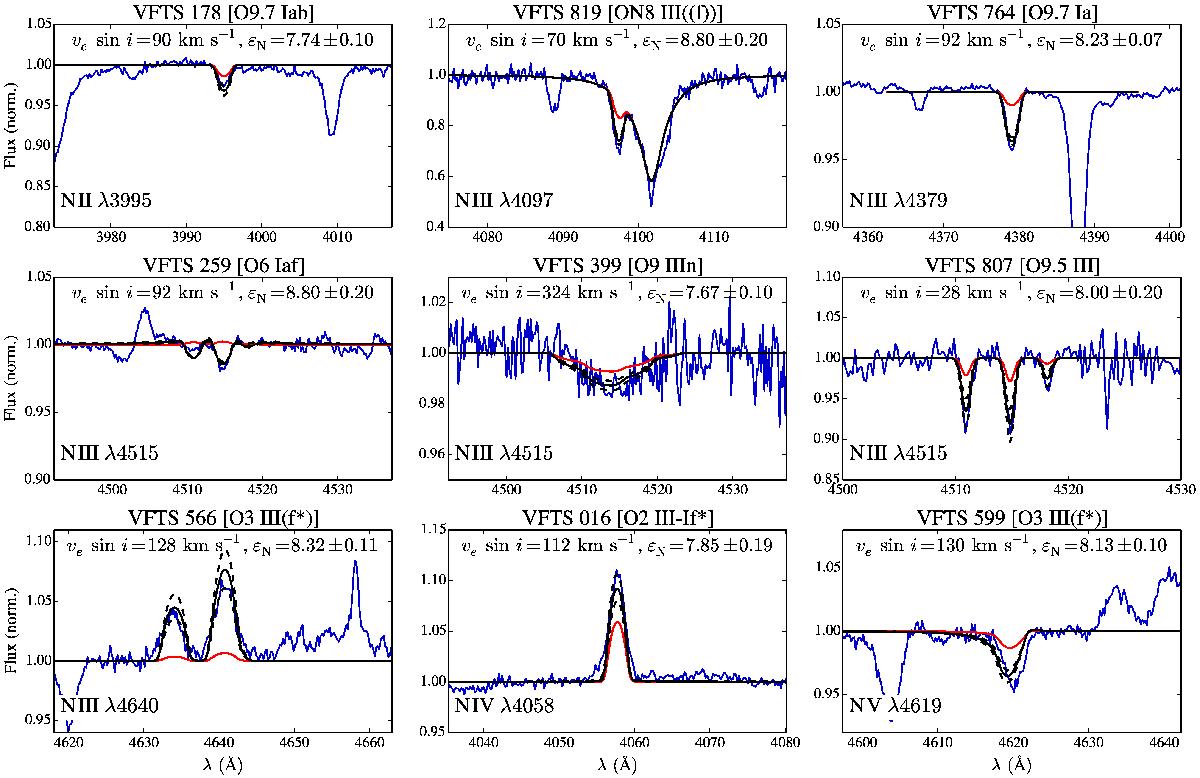
Fig. C.1

Examples of line fits for enriched stars, ranging over spectral types and nitrogen ionisation stage used. The observed spectrum is shown in blue, the best fit model in black (the measured εN is annotated in the panel), models representing the upper and lower 1σ error in dashed black, and a FASTWIND model with εN = 7.33 in red. Only one of the lines used is shown for each source. All sources need a significant nitrogen enrichment in order to reproduce the observed profiles.
Current usage metrics show cumulative count of Article Views (full-text article views including HTML views, PDF and ePub downloads, according to the available data) and Abstracts Views on Vision4Press platform.
Data correspond to usage on the plateform after 2015. The current usage metrics is available 48-96 hours after online publication and is updated daily on week days.
Initial download of the metrics may take a while.


