Fig. 12
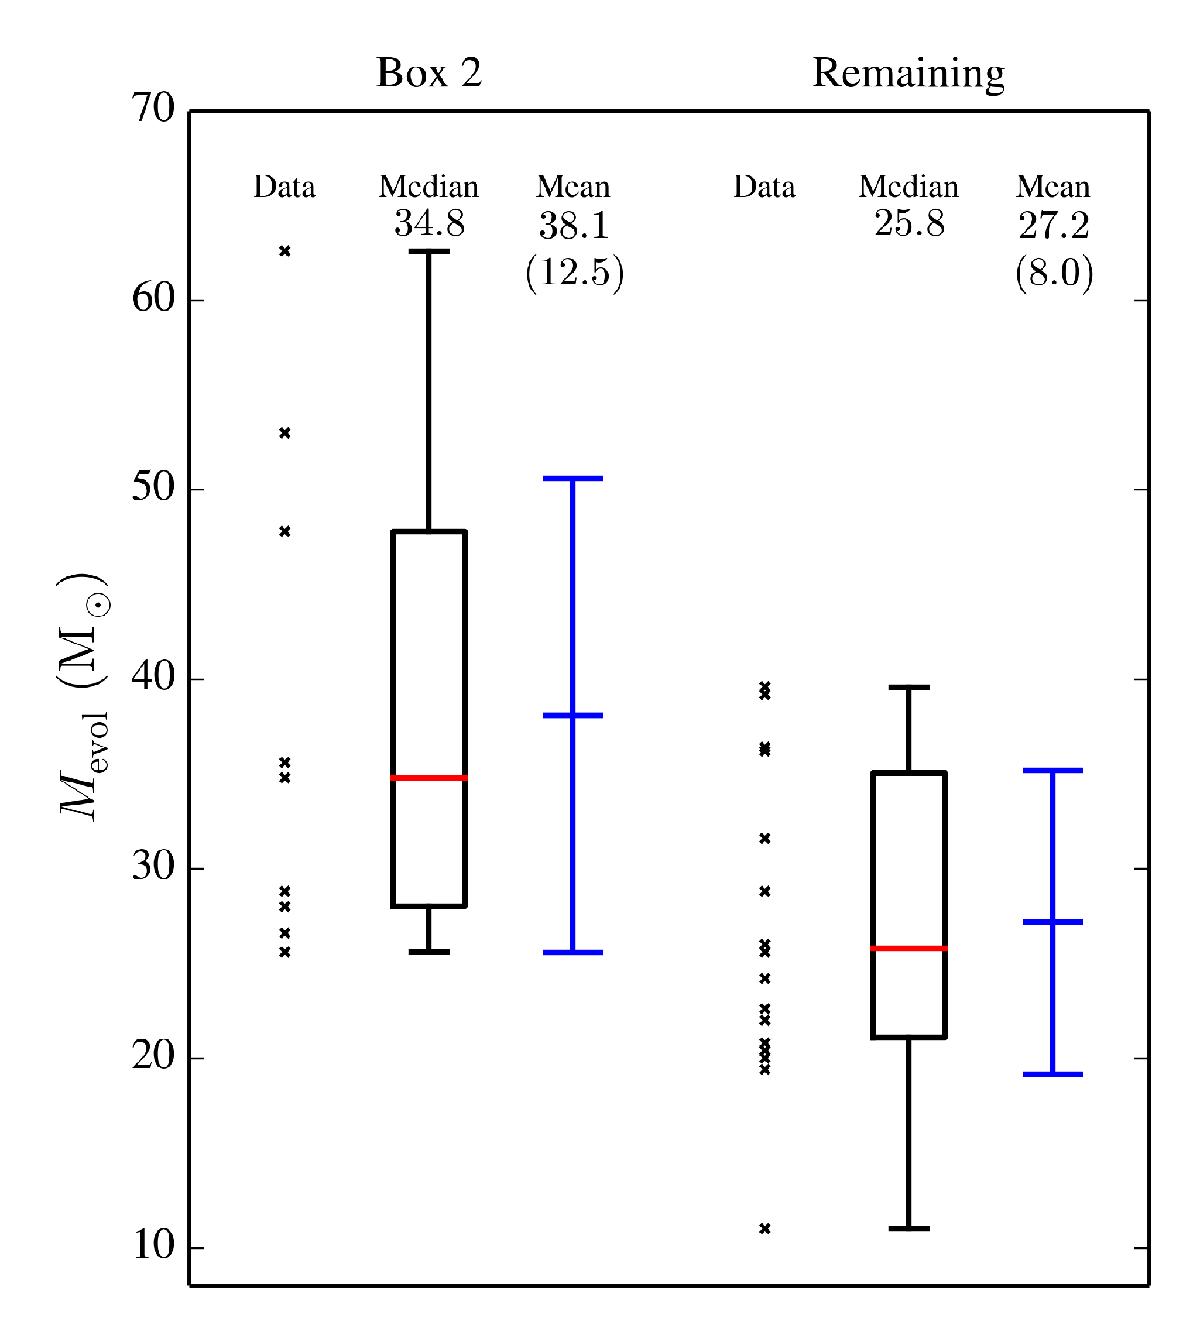
Distribution of evolutionary masses for the stars in Fig. 11 that occupy Box 2 (left) and the remainder of stars (right). Black crosses indicate data points. The middle column in each half of the diagram shows the median of the sample in red, where the boxplot indicates the 0.25 and 0.75 percentiles with whiskers extending out no further than 1.5 times the inter-quartile range. The right column indicates the weighted average and standard deviation (in parentheses) of the sample in blue. Evolutionary masses are calculated using the Bonnsai tool (Sect. 6.1).
Current usage metrics show cumulative count of Article Views (full-text article views including HTML views, PDF and ePub downloads, according to the available data) and Abstracts Views on Vision4Press platform.
Data correspond to usage on the plateform after 2015. The current usage metrics is available 48-96 hours after online publication and is updated daily on week days.
Initial download of the metrics may take a while.