Fig. 10
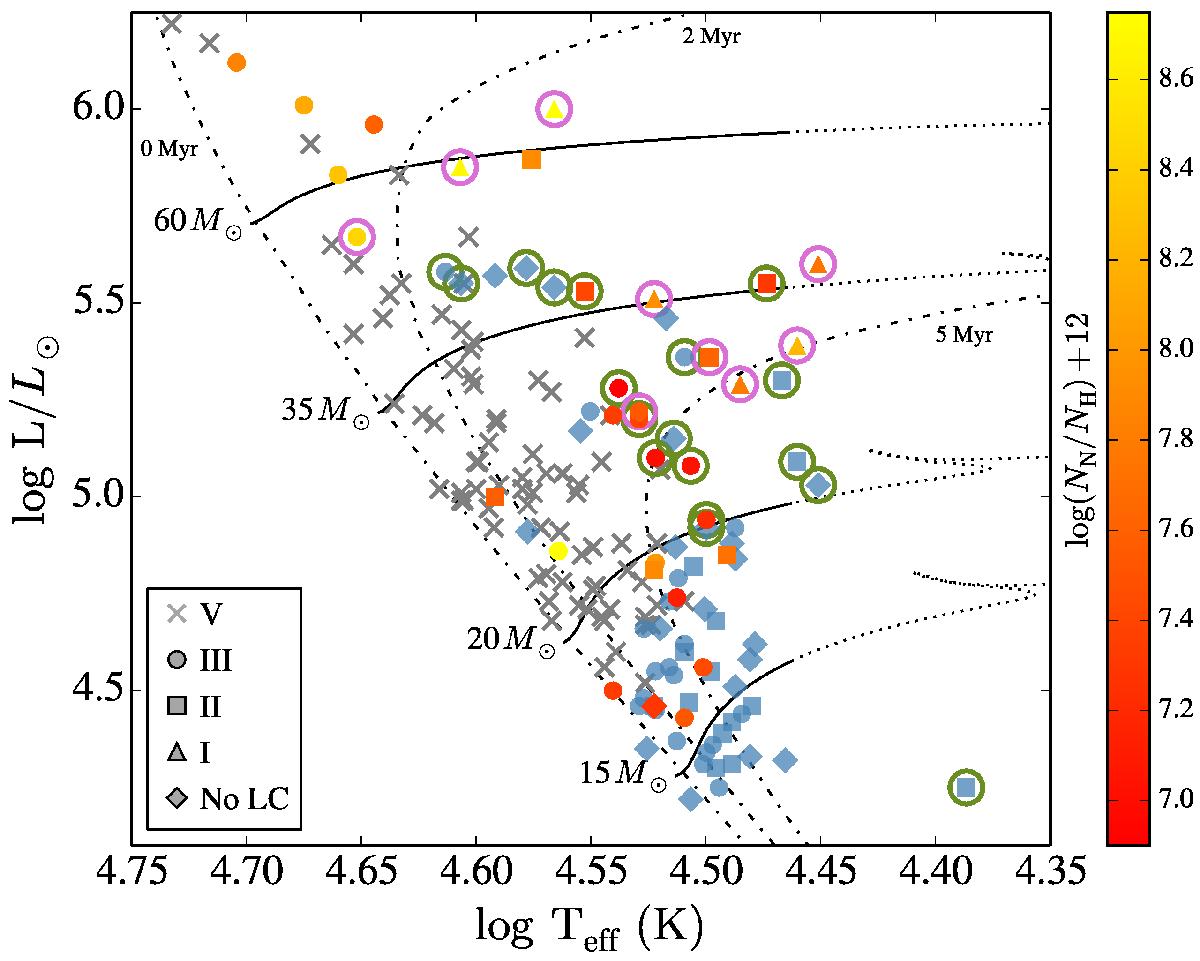
Hertzsprung-Russell Diagram (HRD) for the O-type stars in the VFTS sample, excluding binaries and poor quality fits (Sect. 3.4). Luminosities and temperatures are from Ramírez-Agudelo et al. (2017). Evolutionary sequences and isochrones are from Brott et al. (2011a) and Köhler et al. (2015). The solid tracks alter to dotted tracks for Teff ≤ 29 kK. Grey crosses indicate LC V VFTS stars (Sabín-Sanjulián et al. 2014). The remaining stars are colour-coded according to εN, where upper limits are indicated in blue. Encircled stars have log gc ≤ 3.75, where pink circles indicate that they occupy Box 2 and green circles that they are outside of that box (see Sect. 5.2 and Fig. 11).
Current usage metrics show cumulative count of Article Views (full-text article views including HTML views, PDF and ePub downloads, according to the available data) and Abstracts Views on Vision4Press platform.
Data correspond to usage on the plateform after 2015. The current usage metrics is available 48-96 hours after online publication and is updated daily on week days.
Initial download of the metrics may take a while.