Fig. 1
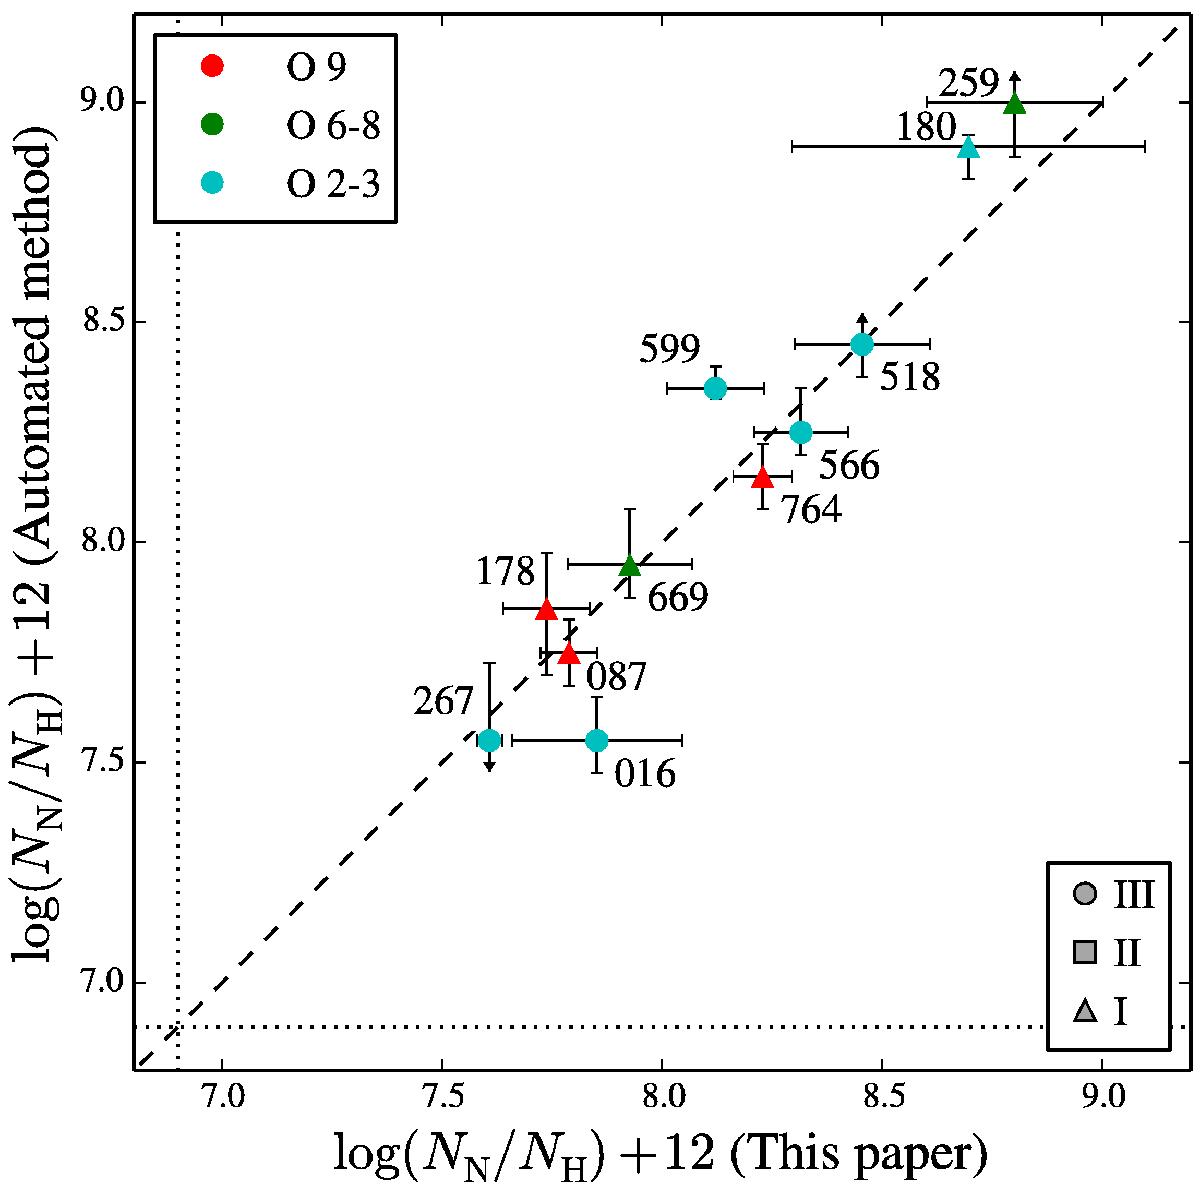
Comparison between nitrogen abundances derived with the automated fitting method (vertical axis) and the method described in Sect. 3 (horizontal axis). Dotted lines indicate the nitrogen baseline abundance of LMC stars. The dashed line shows the 1:1 relation. The observed stars are marked with their VFTS ID. Except for two stars the two methods agree within 1σ. Note that ξm is allowed to vary in the automated method, while ξm is fixed at 10 kms-1 for the measurements in this paper (see Sect. 3.4).
Current usage metrics show cumulative count of Article Views (full-text article views including HTML views, PDF and ePub downloads, according to the available data) and Abstracts Views on Vision4Press platform.
Data correspond to usage on the plateform after 2015. The current usage metrics is available 48-96 hours after online publication and is updated daily on week days.
Initial download of the metrics may take a while.