Fig. 7
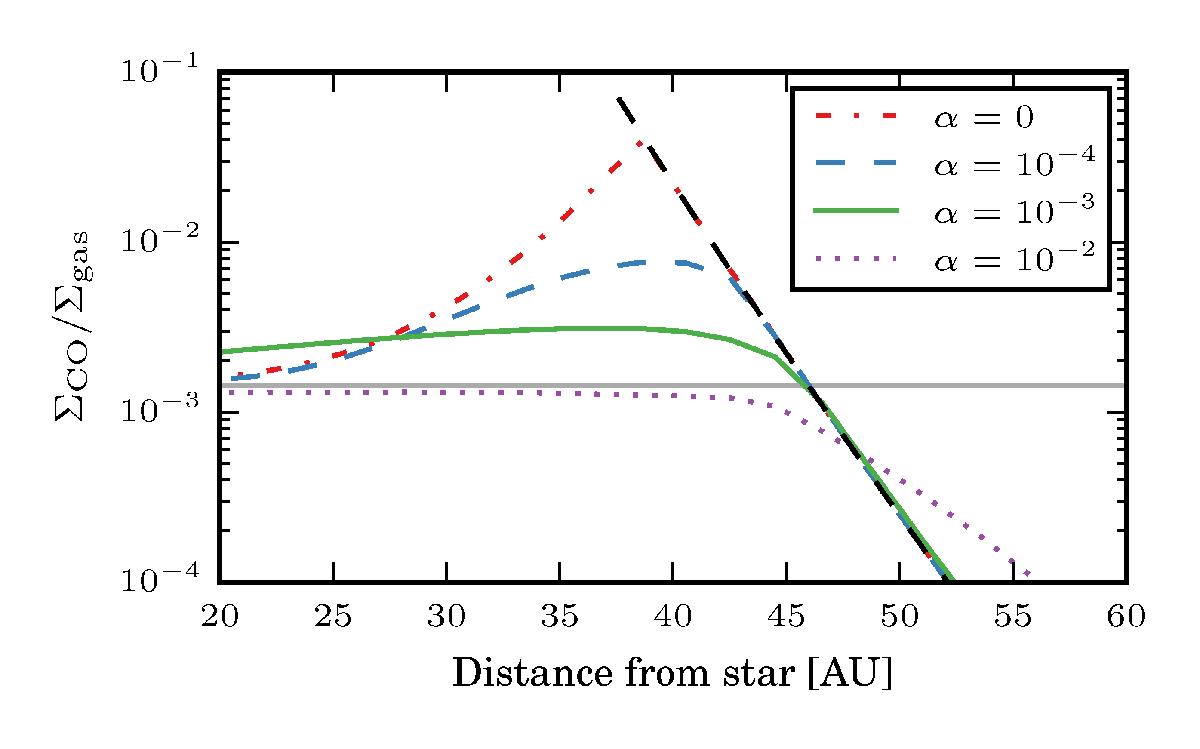
Ratio of CO gas surface density to total gas surface density after 1 Myr in the region of the ice line. Shown are the fiducial model with α = 10-3 (solid green line), a low-viscosity model with α = 10-4 (dashed blue), and a high-viscosity model with α = 10-2 (dotted purple). The ratio of ![]() is plotted with a dashed black line. Also plotted is the case of a disk without viscous spreading (red dash-dotted line). The horizontal gray line is our input value for the CO-to-gas mass ratio.
is plotted with a dashed black line. Also plotted is the case of a disk without viscous spreading (red dash-dotted line). The horizontal gray line is our input value for the CO-to-gas mass ratio.
Current usage metrics show cumulative count of Article Views (full-text article views including HTML views, PDF and ePub downloads, according to the available data) and Abstracts Views on Vision4Press platform.
Data correspond to usage on the plateform after 2015. The current usage metrics is available 48-96 hours after online publication and is updated daily on week days.
Initial download of the metrics may take a while.