Fig. 4
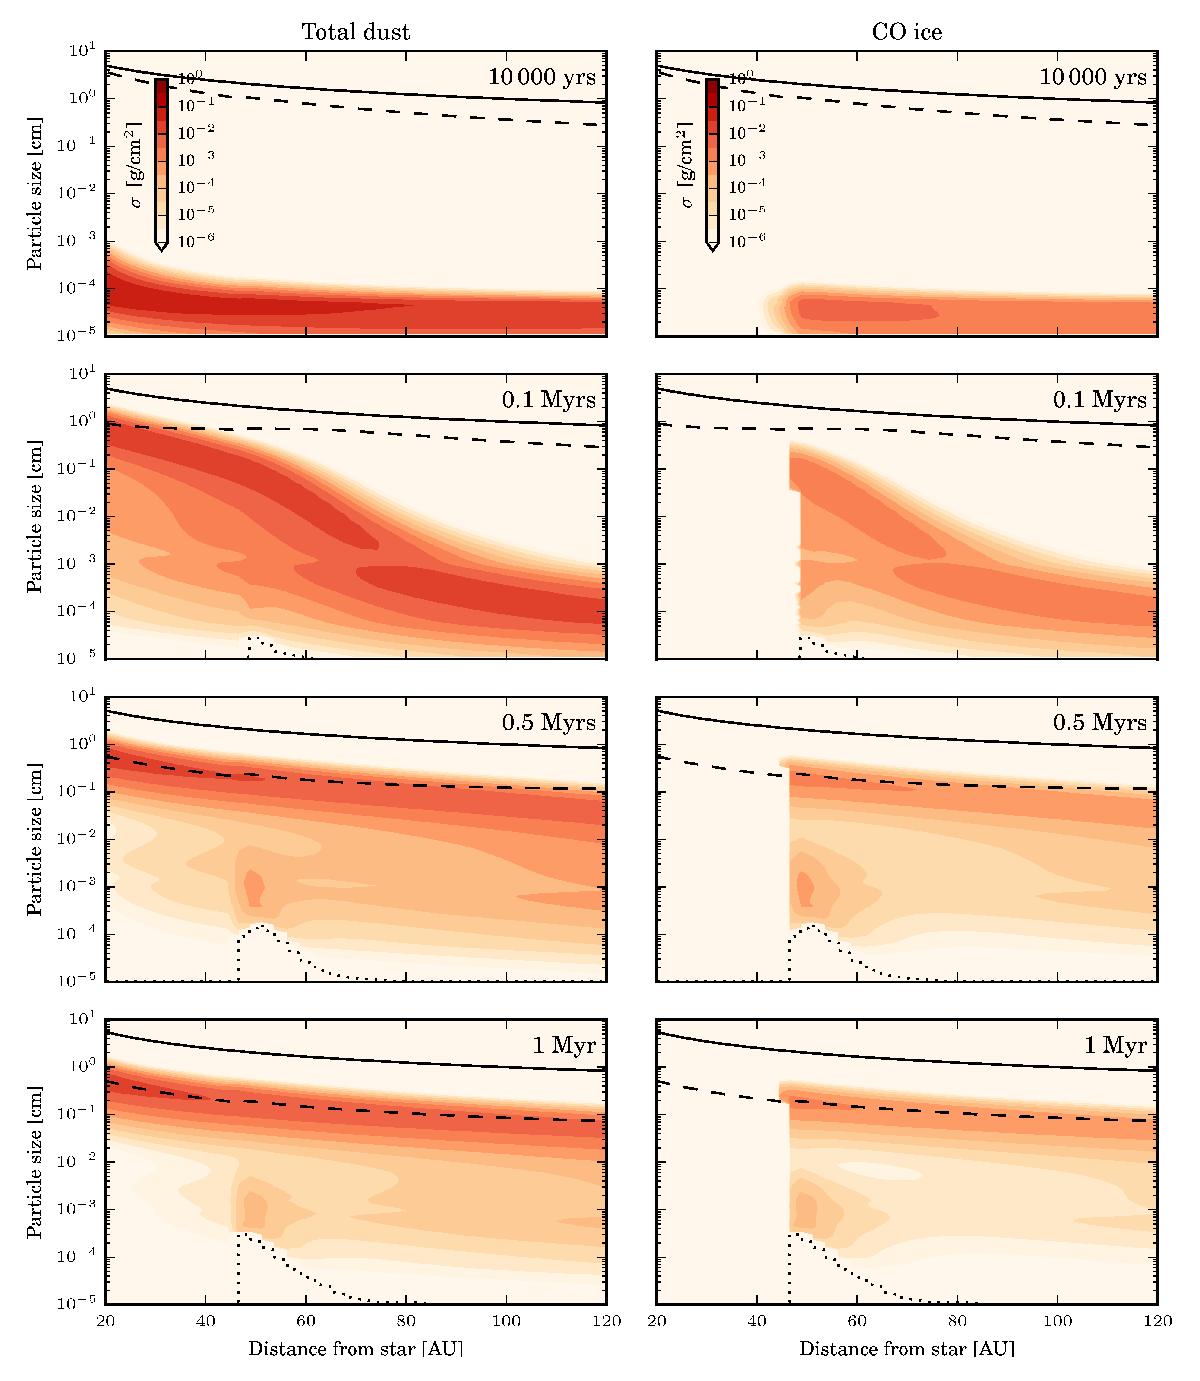
Different snapshots of our fiducial model. Shown are the different distribution functions as defined by Eqs. (43) at 10 000 yr, 100 000 yr, 500 000 yr, and at 1 Myr. The solid line denotes the particle sizes with Stokes number unity, The dashed line is an analytical estimation of the drift barrier. The dotted line encompasses a region outside of the ice line that is free of small particles.
Current usage metrics show cumulative count of Article Views (full-text article views including HTML views, PDF and ePub downloads, according to the available data) and Abstracts Views on Vision4Press platform.
Data correspond to usage on the plateform after 2015. The current usage metrics is available 48-96 hours after online publication and is updated daily on week days.
Initial download of the metrics may take a while.