Fig. 9
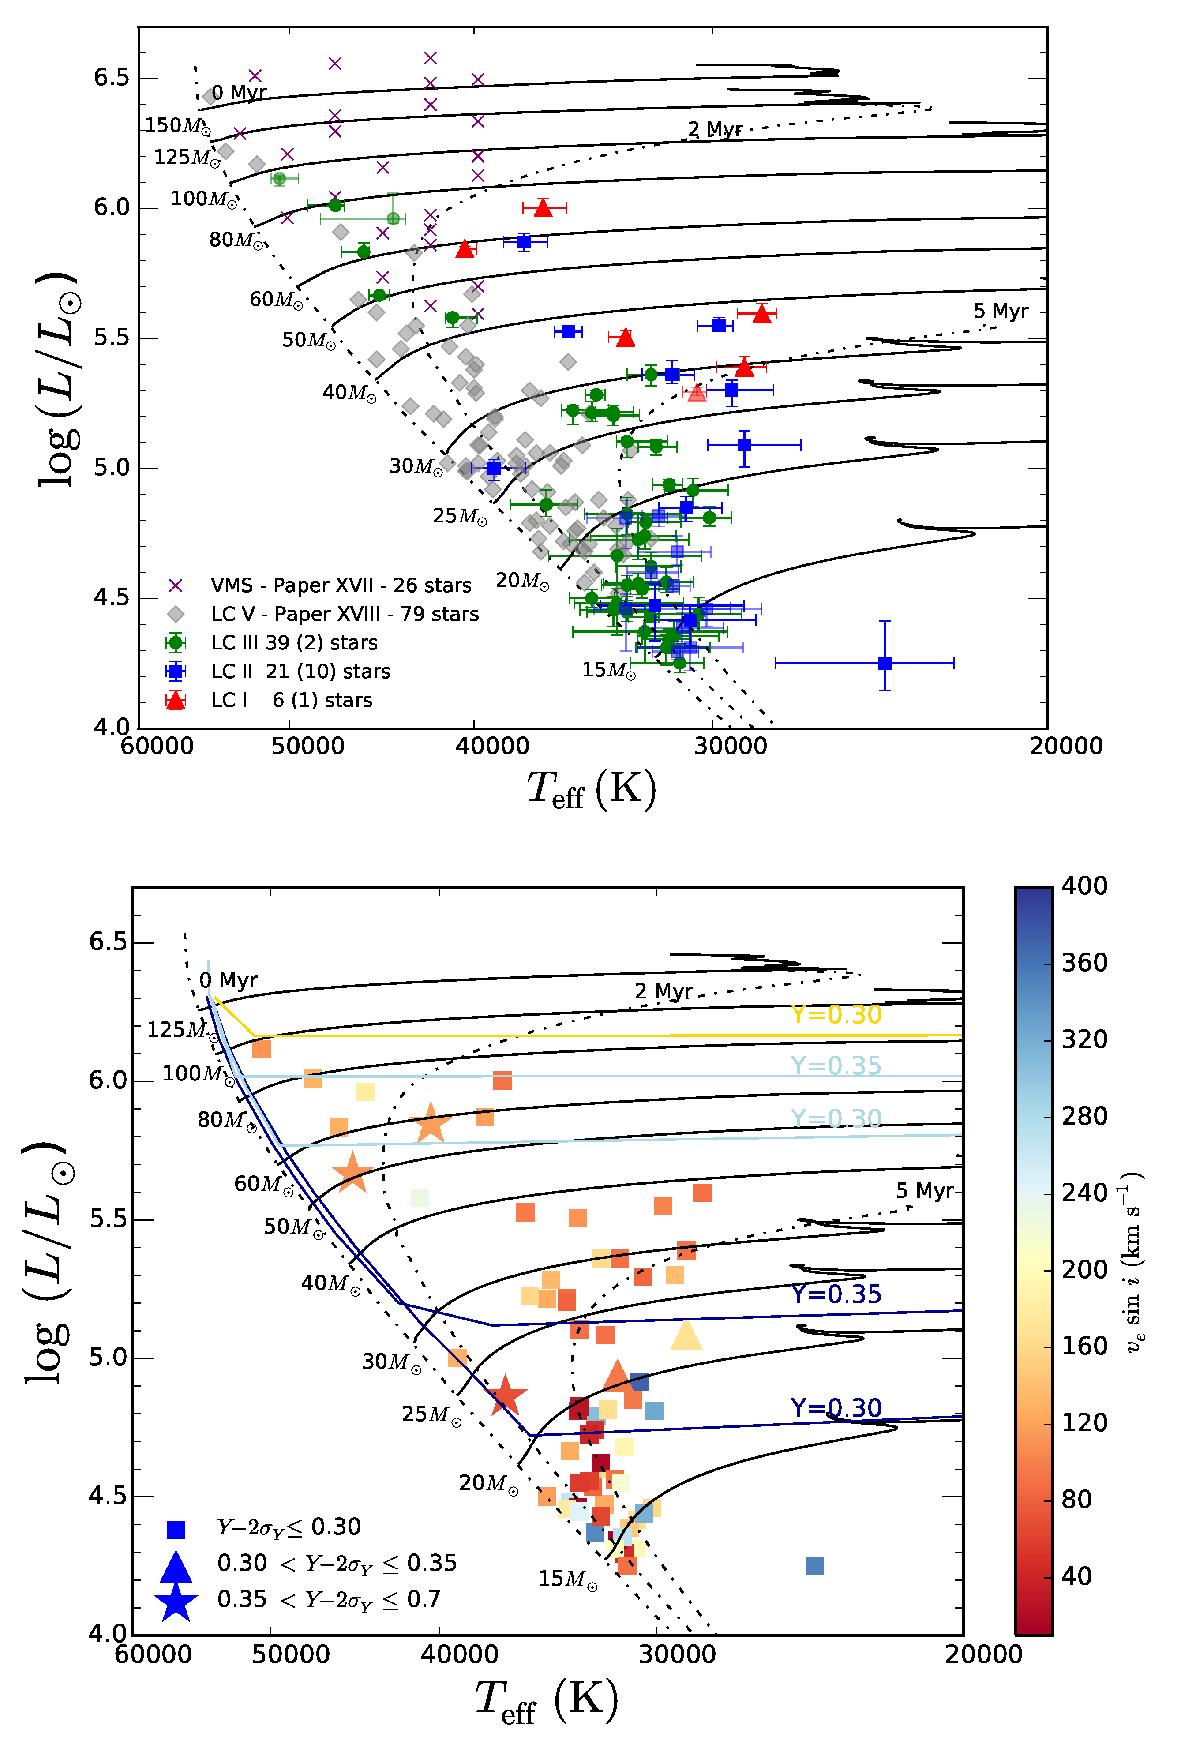
Two versions of the Hertzsprung-Russell diagram. In the top panel our sample of single O-type giants and supergiants is supplemented with the dwarf O star sample of Paper XIII and the sample of very massive Of and WNh stars by Paper XVII. We exclude the results of Paper XVII for the nine stars in common with this paper and adopted our results (see Sect. 3.4.3). Symbols and colors have the same meaning as in Fig. 6. The lower panel only contains the sample studied here. The symbol shapes in the lower panel show three categories of helium mass fraction, that is, not enriched (squares), moderately enriched (triangles), and enriched (stars). The symbol colors refer to their projected rotational velocity (see color bar on the right). Evolutionary tracks and isochrones are for models that have an initial rotational velocity of approximately 200 kms-1 (Brott et al. 2011; Köhler et al. 2015). Iso-helium lines for different rotational velocities are from Köhler et al. (2015) and are color-coded using the color bar.
Current usage metrics show cumulative count of Article Views (full-text article views including HTML views, PDF and ePub downloads, according to the available data) and Abstracts Views on Vision4Press platform.
Data correspond to usage on the plateform after 2015. The current usage metrics is available 48-96 hours after online publication and is updated daily on week days.
Initial download of the metrics may take a while.