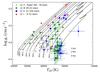
Fig. 6
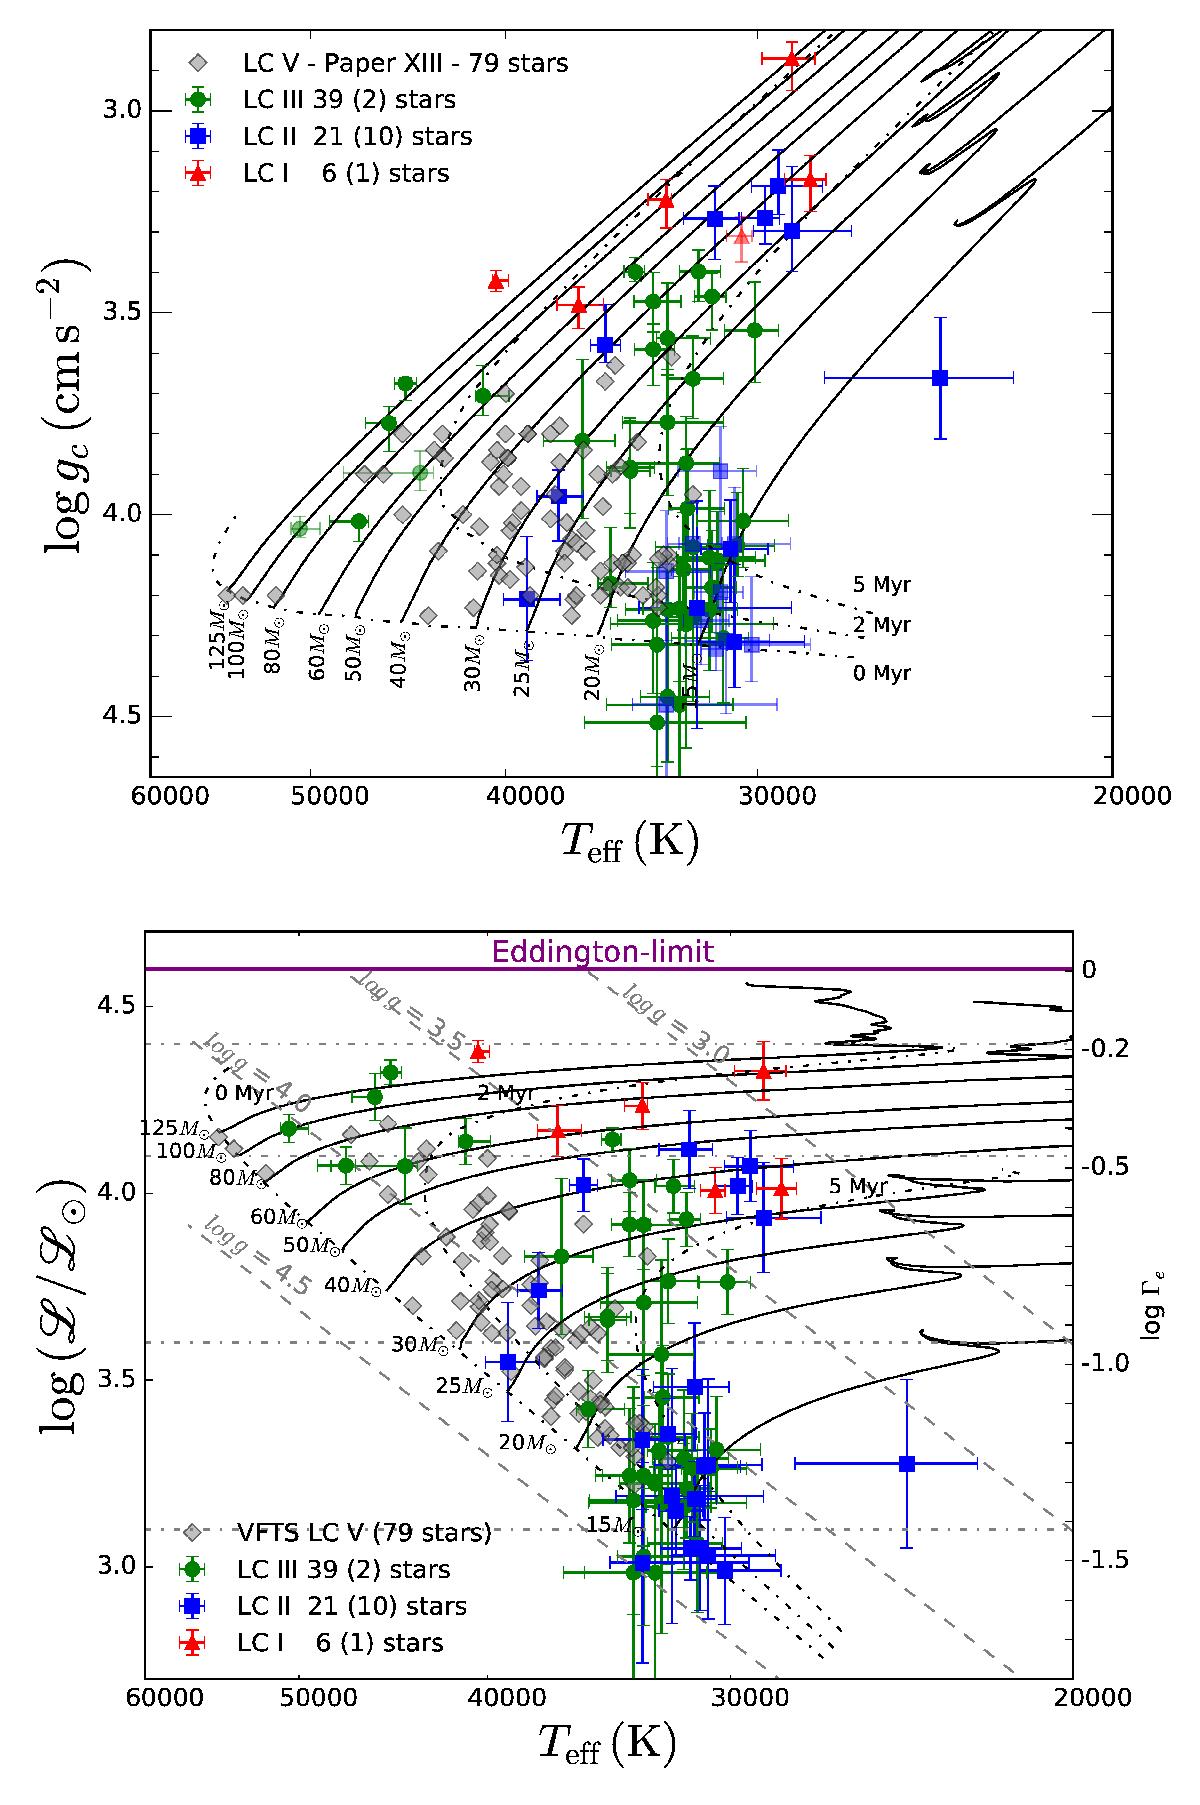
log gc vs. log Teff (upper panel) and spectroscopic Hertzsprung-Russell (lower panel) diagrams of the O-type giants, bright giants, and supergiants, where ![]() (see Sect. 4.2). Symbols and colors have the same meaning as in Fig. 5. Evolutionary tracks and isochrones are for models that have an initial rotational velocity of approximately 200 kms-1 (Brott et al. 2011; Köhler et al. 2015). In the lower panel, the right-hand axis gives the classical Eddington factor Γe for the opacity of free electrons in a fully ionized plasma with solar helium abundance (cf. Langer & Kudritzki 2014). The horizontal line at log L/ L⊙ = 4.6 indicates the location of the corresponding Eddington limit. The dashed straight lines are lines of constant log g as indicated. Lower opacities of the green and blue symbols and the numbers in parentheses in the legend have the same meaning as in Fig. 1.
(see Sect. 4.2). Symbols and colors have the same meaning as in Fig. 5. Evolutionary tracks and isochrones are for models that have an initial rotational velocity of approximately 200 kms-1 (Brott et al. 2011; Köhler et al. 2015). In the lower panel, the right-hand axis gives the classical Eddington factor Γe for the opacity of free electrons in a fully ionized plasma with solar helium abundance (cf. Langer & Kudritzki 2014). The horizontal line at log L/ L⊙ = 4.6 indicates the location of the corresponding Eddington limit. The dashed straight lines are lines of constant log g as indicated. Lower opacities of the green and blue symbols and the numbers in parentheses in the legend have the same meaning as in Fig. 1.
Current usage metrics show cumulative count of Article Views (full-text article views including HTML views, PDF and ePub downloads, according to the available data) and Abstracts Views on Vision4Press platform.
Data correspond to usage on the plateform after 2015. The current usage metrics is available 48-96 hours after online publication and is updated daily on week days.
Initial download of the metrics may take a while.