Fig. 5
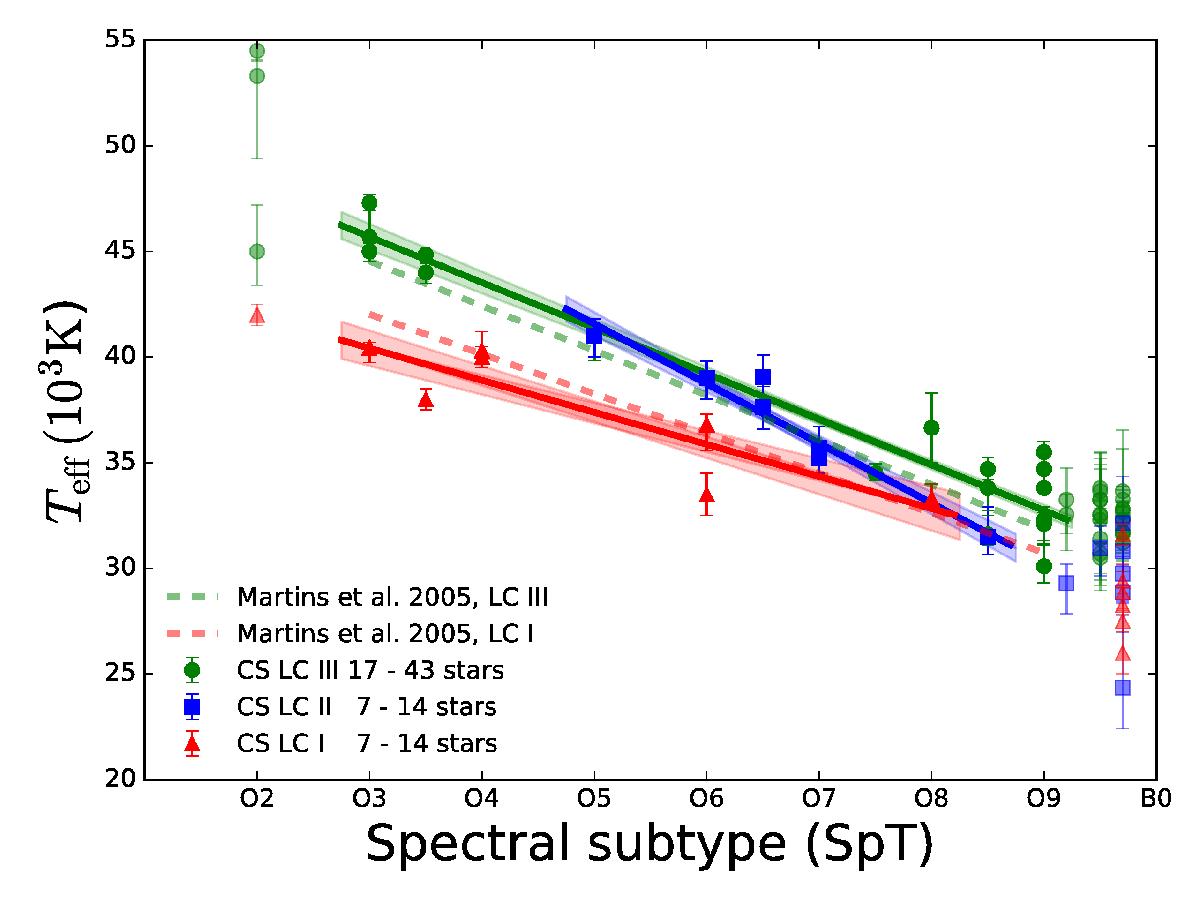
Effective temperature vs. spectral subtype but now displaying fits that combine our sample with that of Mokiem et al. (2007b): CS = Combined sample (see main text). Stars with spectral subtype O2-3 or later than O9 have been plotted with lower opacity. The dashed lines give the theoretical calibrations of Martins et al. (2005) for Galactic class III and I stars. The leading number in the legend refers to the total number of O3-O9 stars for which the fit has been derived. The trailing number refers to the total number of stars in each sample.
Current usage metrics show cumulative count of Article Views (full-text article views including HTML views, PDF and ePub downloads, according to the available data) and Abstracts Views on Vision4Press platform.
Data correspond to usage on the plateform after 2015. The current usage metrics is available 48-96 hours after online publication and is updated daily on week days.
Initial download of the metrics may take a while.