Fig. 2
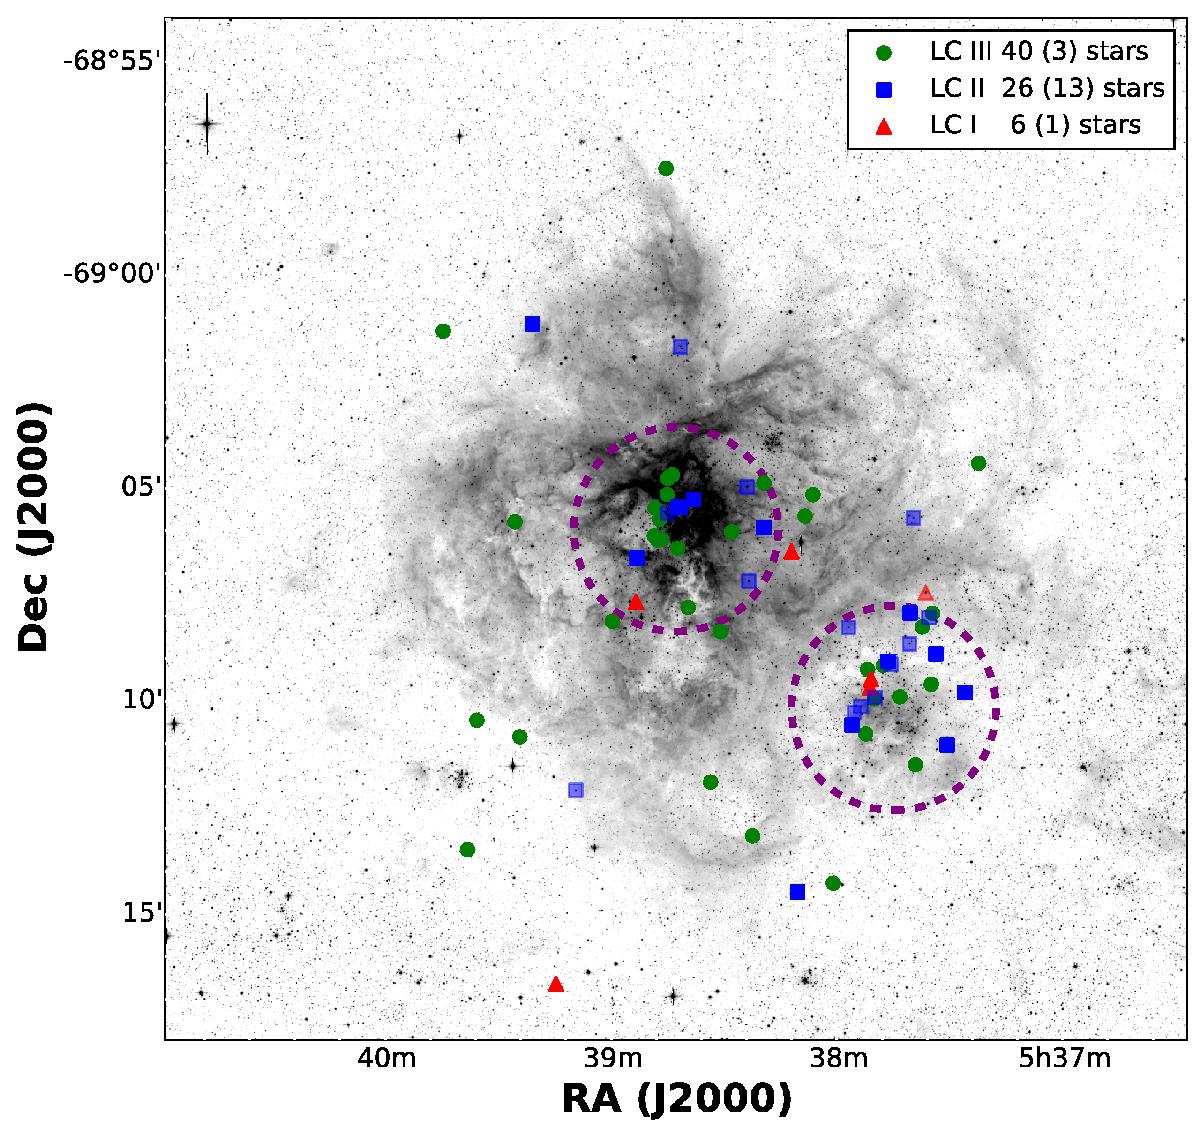
Spatial distribution of the presumably single O-type stars as a function of LC. North is to the top; east is to the left. The circles define regions within 2.4′ of NGC 2070 (central circle) and NGC 2060 (south-west circle). Different symbols indicate LC: III (circles), II (squares), I (triangles). Note that because of crowding a considerable fraction of the sources overlap. Lower opacities again denote sources with an ambiguous LC classification, similar as in Fig. 1.
Current usage metrics show cumulative count of Article Views (full-text article views including HTML views, PDF and ePub downloads, according to the available data) and Abstracts Views on Vision4Press platform.
Data correspond to usage on the plateform after 2015. The current usage metrics is available 48-96 hours after online publication and is updated daily on week days.
Initial download of the metrics may take a while.