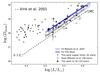
Fig. 10
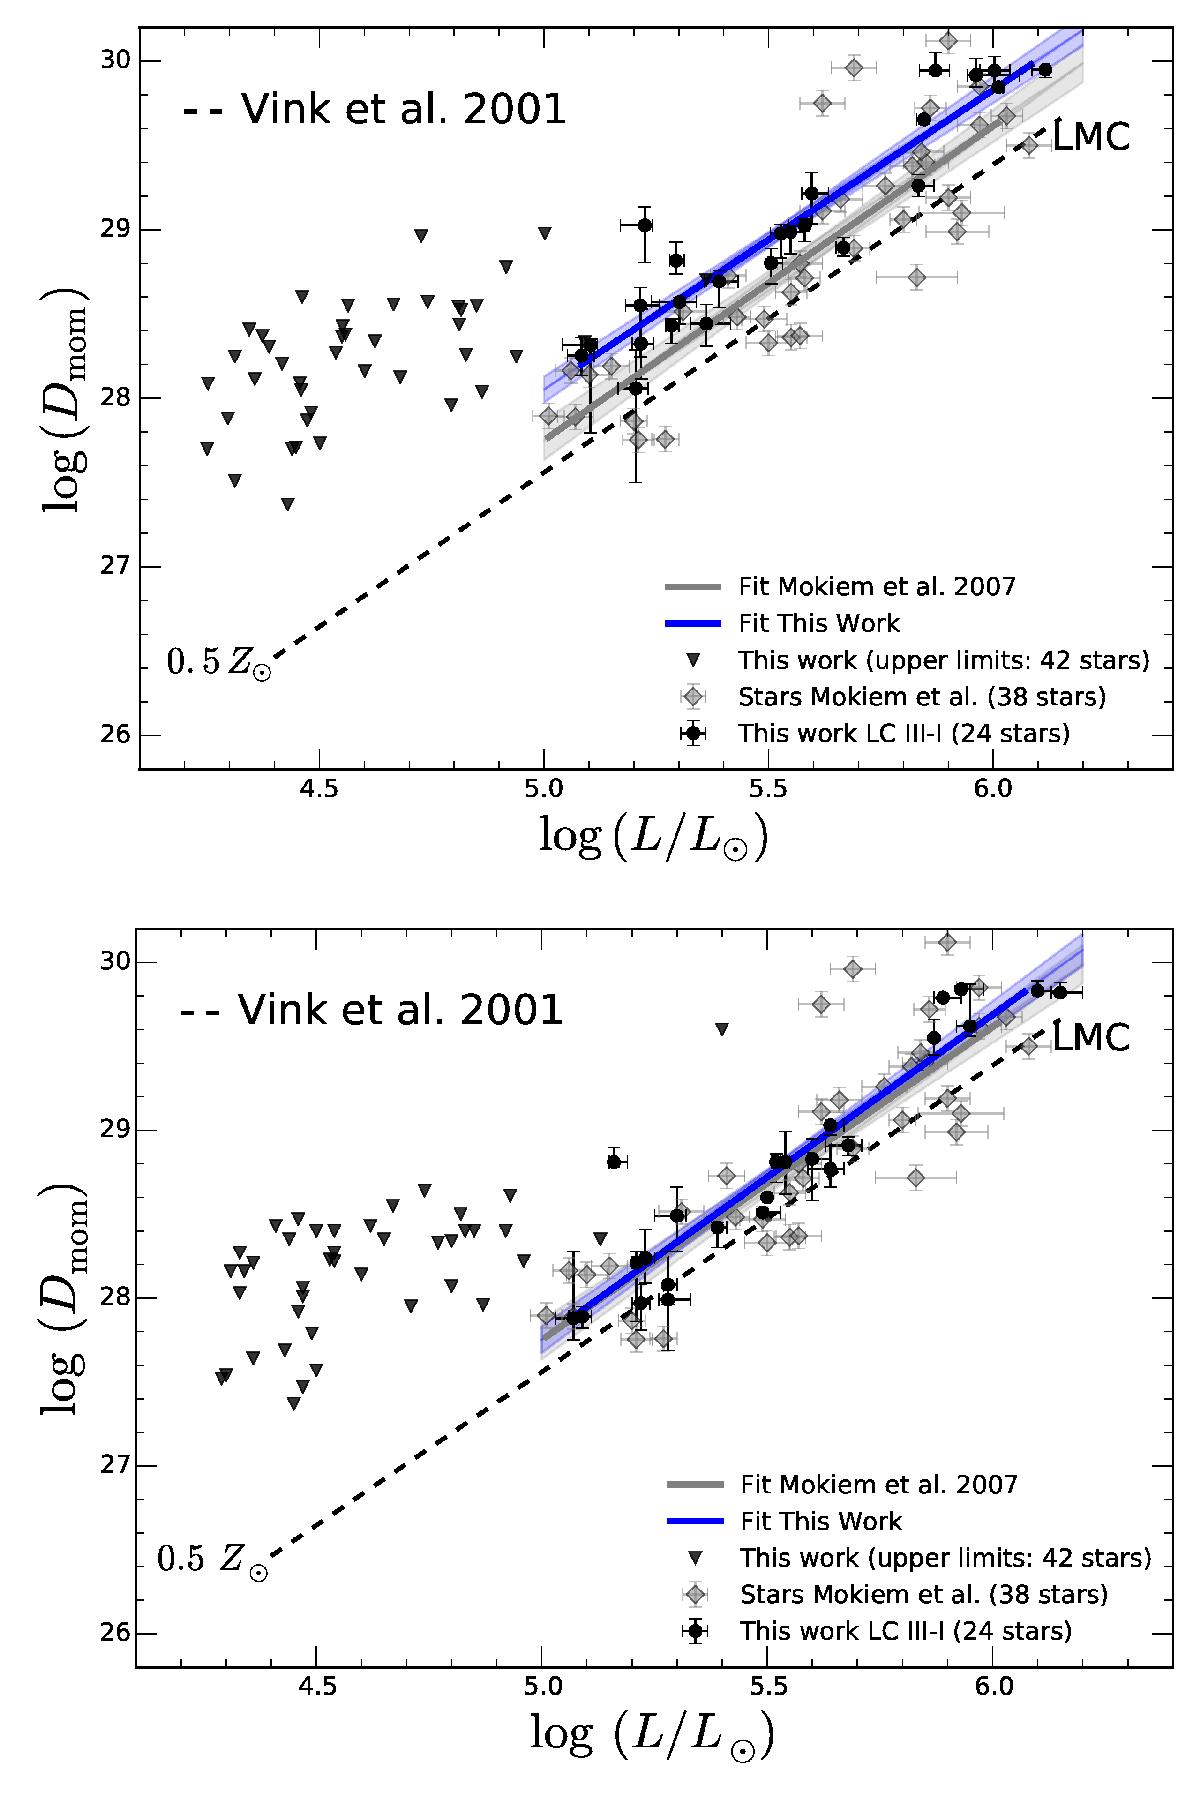
Modified wind momentum (Dmom) vs. luminosity diagram. The dashed lines indicate the theoretical predictions of Vink et al. (2001) for homogeneous winds. Top panel: the empirical fit for this work and Mokiem et al. (2007a) (both for L/L⊙> 5.0) in shaded blue and gray bars, respectively. For stars with L/L⊙ ≤ 5.0, only upper limits could be constrained. These stars are not considered in the analysis. Bottom panel: same as top panel but now for an analysis in which the acceleration of the wind flow, β, is a free parameter and in which the analysis does not include nitrogen lines, but relies on hydrogen and helium lines only.
Current usage metrics show cumulative count of Article Views (full-text article views including HTML views, PDF and ePub downloads, according to the available data) and Abstracts Views on Vision4Press platform.
Data correspond to usage on the plateform after 2015. The current usage metrics is available 48-96 hours after online publication and is updated daily on week days.
Initial download of the metrics may take a while.