Fig. 5
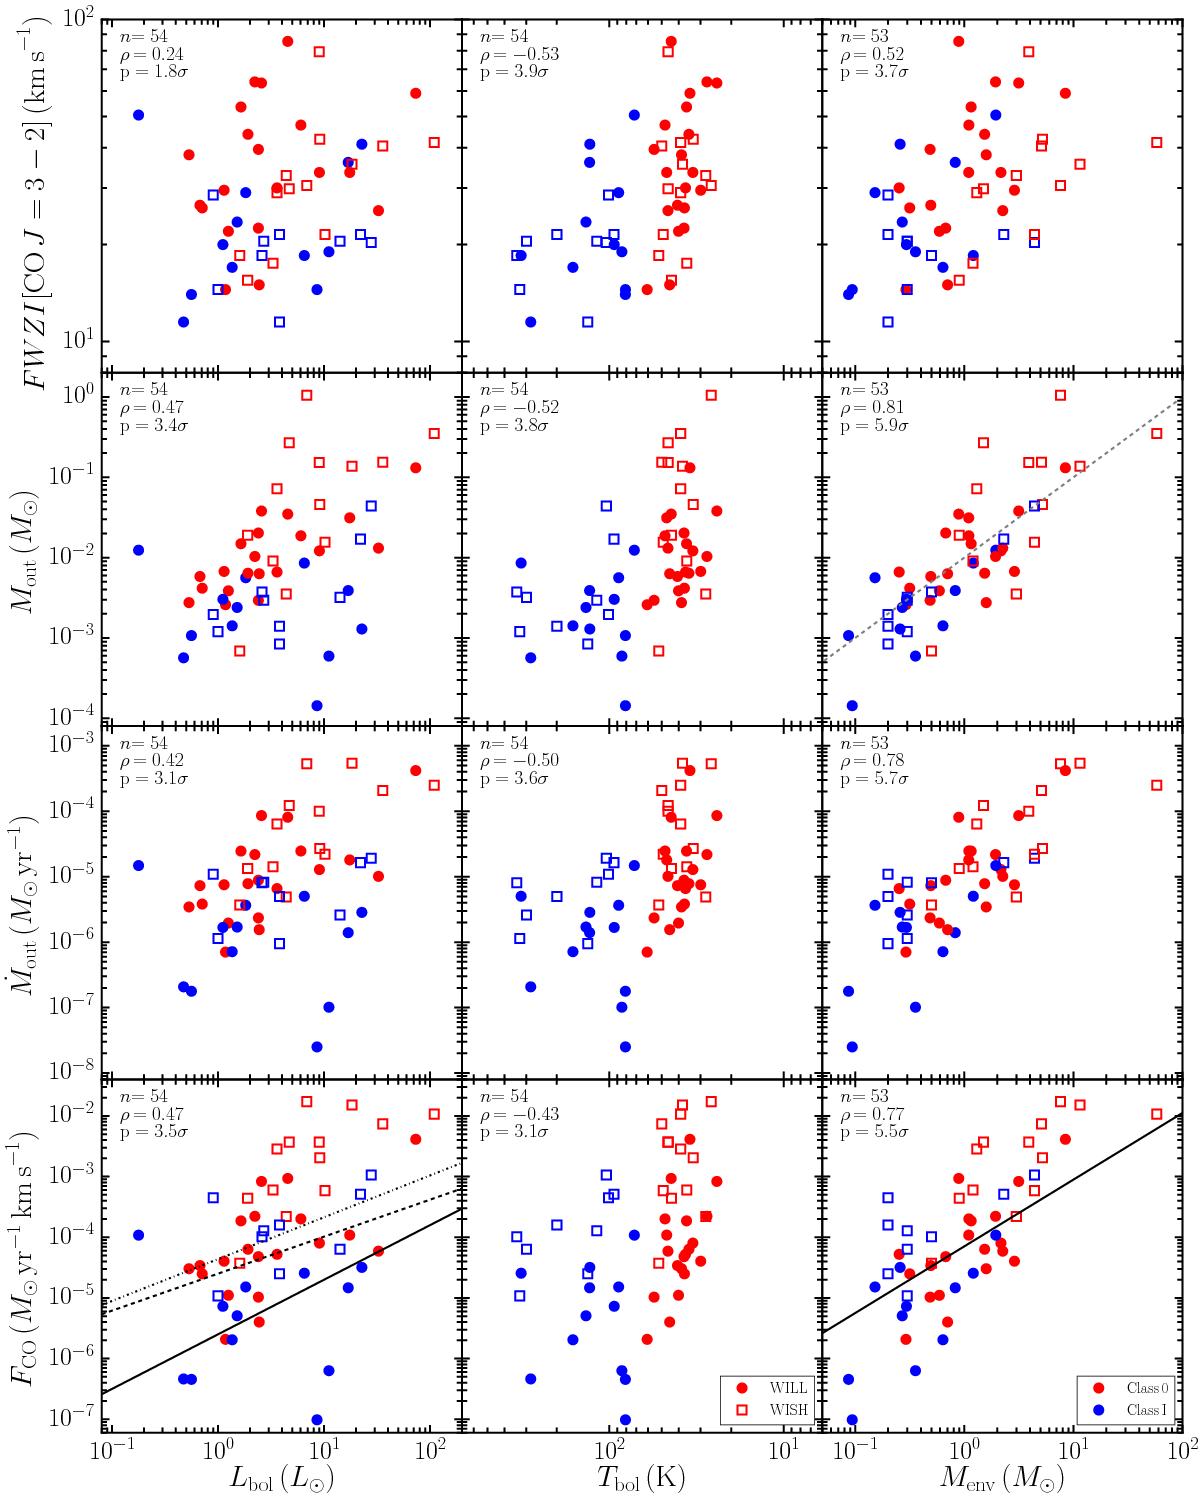
Comparison of FWZI, Mout, Ṁout and FCO obtained from CO J = 3−2 maps with Lbol, Tbol and Menv for the WILL (filled symbols) and WISH (open symbols) sources. The number of sources, correlation coefficient and probability that the correlation is not simply due to random distributions in the variables are shown in the upper-left of each panel. The grey dashed line in the panel for Mout vs. Menv indicates where Mout/Menv = 1%. The solid black lines show the relations found by Bontemps et al. (1996) between FCO, Lbol and Menv for a sample of Class I sources. The dot-dashed black line shows the best-fit found between FCO and Lbol by Cabrit & Bertout (1992) for a sample of Class 0 sources, while the dashed black line shows an extension to the low-mass regime of the fit to a sample of massive young sources from Maud et al. (2015).
Current usage metrics show cumulative count of Article Views (full-text article views including HTML views, PDF and ePub downloads, according to the available data) and Abstracts Views on Vision4Press platform.
Data correspond to usage on the plateform after 2015. The current usage metrics is available 48-96 hours after online publication and is updated daily on week days.
Initial download of the metrics may take a while.