Fig. 9
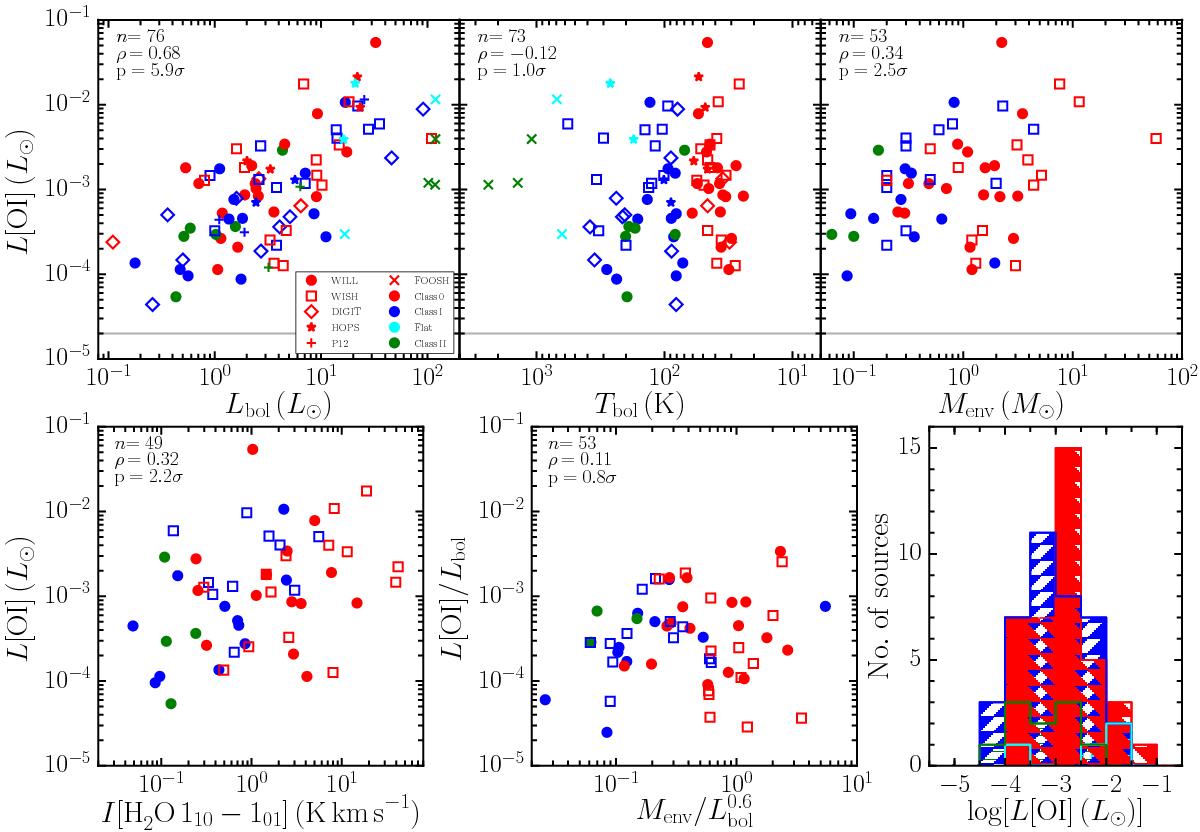
[O i] luminosity vs. Lbol (top-left), Tbol (top-middle), Menv (top-right) and integrated intensity in the H2O 110 −101 transition (bottom-left). Bottom-middle: [O i] luminosity normalised by Lbol vs. the evolutionary indicator ![]() proposed by Bontemps et al. (1996). The plots include data from the WILL, WISH and DIGIT samples, as well as from the literature from Podio et al. (2012) and the HOPS (Watson et al. 2016) and FOOSH (Green et al. 2013b) surveys where available. The number of sources and correlation statistics in the upper-right of each panel include only Class 0/I sources so as to be conservative. The horizontal grey line in the top panels indicates the upper limit for disk emission from Howard et al. (2013). Bottom-right: histogram of L[O i] as a function of spectral type, including sources from all surveys.
proposed by Bontemps et al. (1996). The plots include data from the WILL, WISH and DIGIT samples, as well as from the literature from Podio et al. (2012) and the HOPS (Watson et al. 2016) and FOOSH (Green et al. 2013b) surveys where available. The number of sources and correlation statistics in the upper-right of each panel include only Class 0/I sources so as to be conservative. The horizontal grey line in the top panels indicates the upper limit for disk emission from Howard et al. (2013). Bottom-right: histogram of L[O i] as a function of spectral type, including sources from all surveys.
Current usage metrics show cumulative count of Article Views (full-text article views including HTML views, PDF and ePub downloads, according to the available data) and Abstracts Views on Vision4Press platform.
Data correspond to usage on the plateform after 2015. The current usage metrics is available 48-96 hours after online publication and is updated daily on week days.
Initial download of the metrics may take a while.