Fig. 1
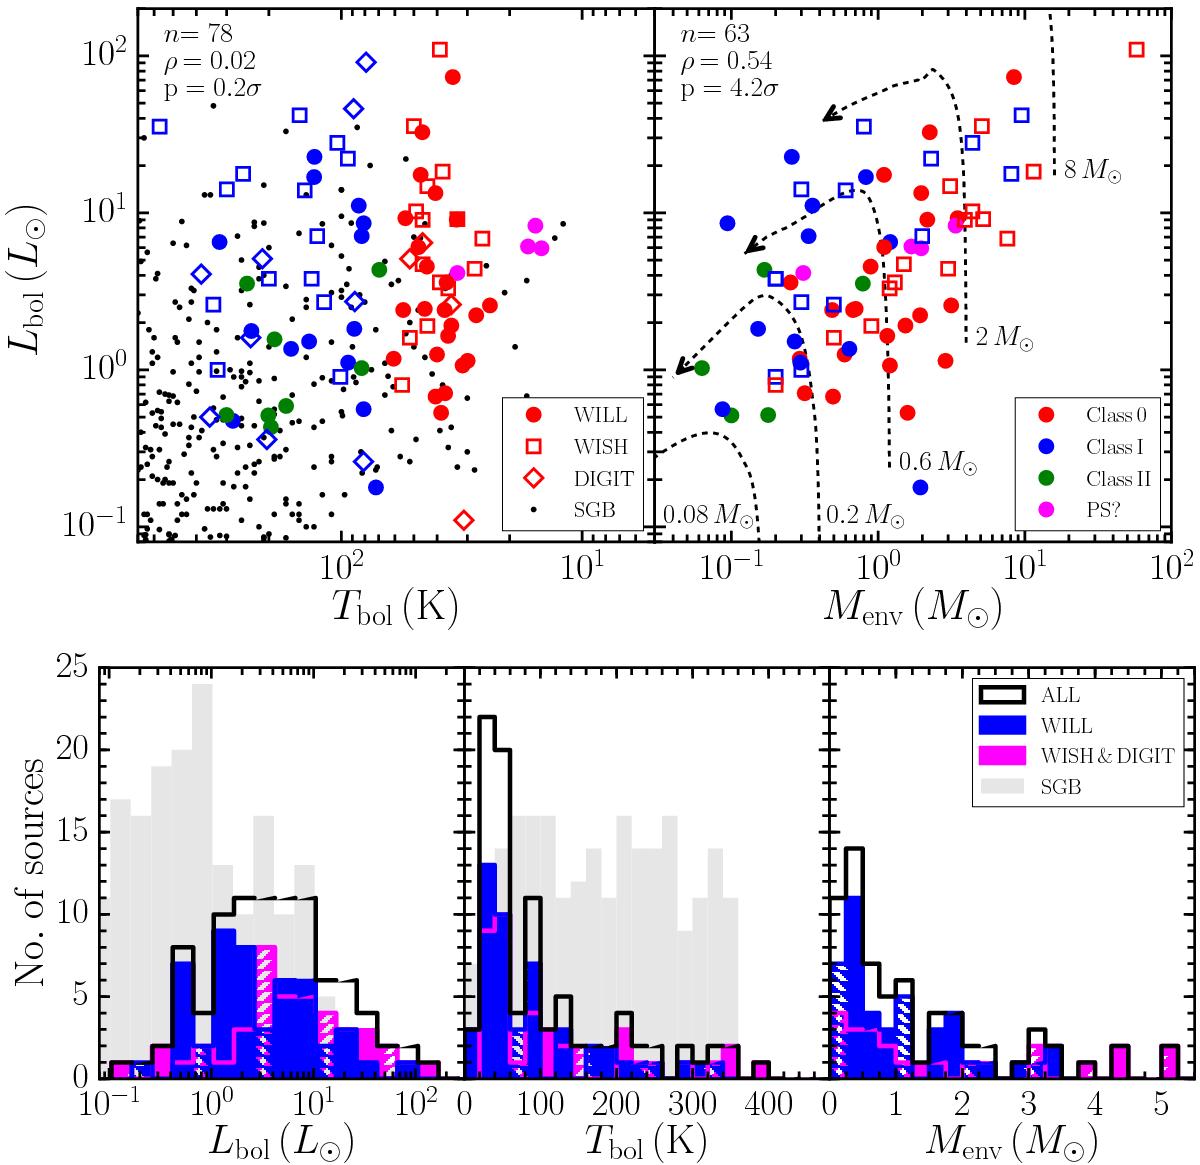
Top: distribution of Lbol vs. Tbol and Menv for the WILL (filled circles), WISH (open squares) and DIGIT (open diamonds) surveys. In the left-hand panel, the Spitzer Gould Belt (SGB) determinations from Dunham et al. (2015) are shown for comparison (black dots). The different colours are used to distinguish between different source classifications: Class 0 (red), Class I (blue) Class II (green) and pre-stellar (PS, magenta). The number of sources (n), Pearson correlation coefficient (ρ), and the probability (p) that the correlation is not just due to random distributions in the variables are shown in the upper-left of each panel including only Class 0/I sources. Evolutionary tracks between Lbol and Menv from Duarte-Cabral et al. (2013) are shown in the right-hand panel (see text for details), with the final stellar mass indicated for each track. Bottom: histograms showing the distribution of Lbol, Tbol and Menv for the WILL (blue), combined WISH and DIGIT (magenta hatched), and total WILL, WISH and DIGIT (black) samples. The grey shaded region indicates the distribution of the Spitzer Gould Belt determinations for sources with Tbol ≤ 350 K.
Current usage metrics show cumulative count of Article Views (full-text article views including HTML views, PDF and ePub downloads, according to the available data) and Abstracts Views on Vision4Press platform.
Data correspond to usage on the plateform after 2015. The current usage metrics is available 48-96 hours after online publication and is updated daily on week days.
Initial download of the metrics may take a while.