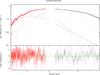
Fig. 2
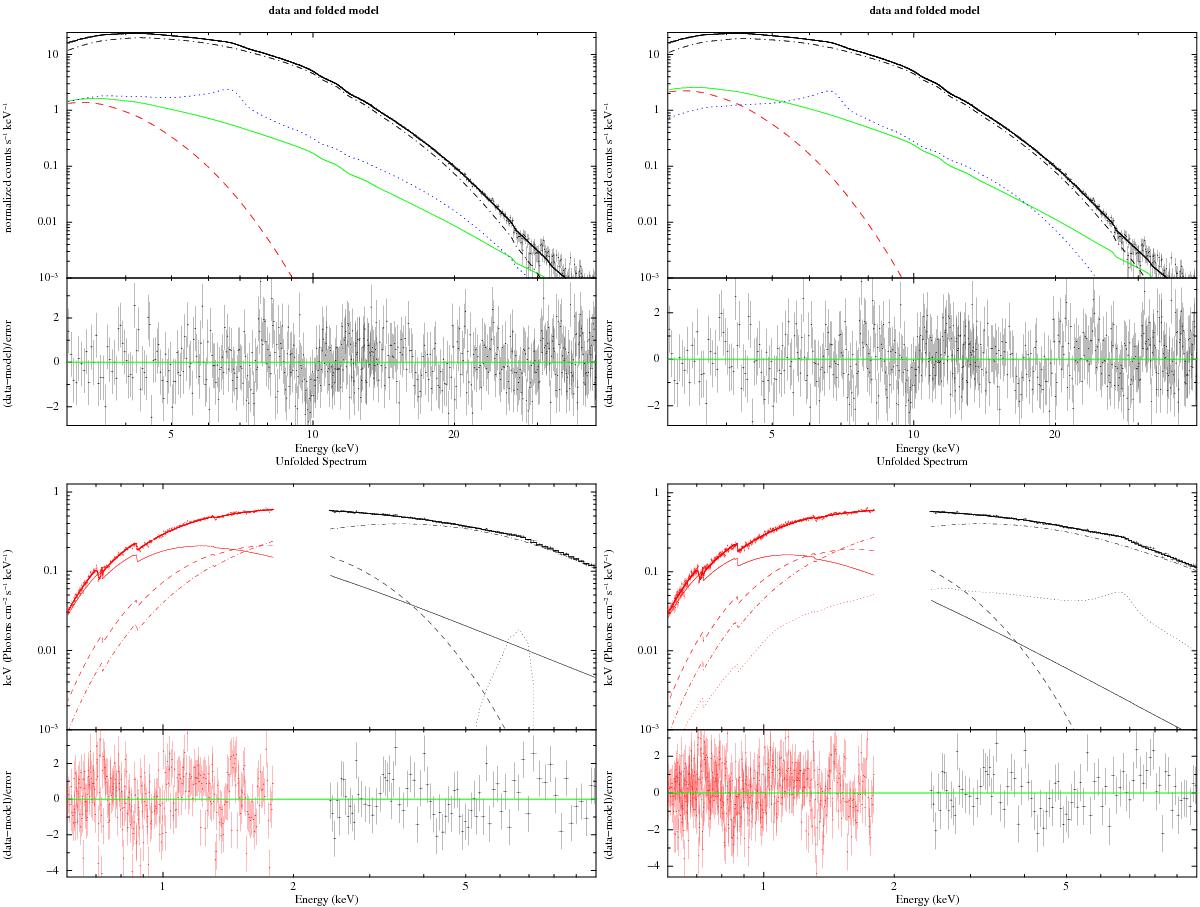
Top panels: NuSTAR spectra of Ser X-1 and best-fitting model together with residuals in units of sigma for the corresponding model. These are; top-left: “rdb-reflio-pl”, top-right: “rdb-rfxconv-pl”. Bottom panels: XMM-Newton spectra and best-fitting model together with residuals in units of sigma for the corresponding model. These are: bottom-left: “diskline-pl-xmm”, and bottom-right: “rdb-rfxconv-pl-xmm”. For clarity, only the first XMM-Newton observation is shown. Dashed lines indicate the black-body component, dotted lines indicate the reflection components (i.e., the Diskline profile for the iron line or the self-consistent reflection component), the solid line indicates the power-law component, and the dashed-dotted lines indicate the comptonized component.
Current usage metrics show cumulative count of Article Views (full-text article views including HTML views, PDF and ePub downloads, according to the available data) and Abstracts Views on Vision4Press platform.
Data correspond to usage on the plateform after 2015. The current usage metrics is available 48-96 hours after online publication and is updated daily on week days.
Initial download of the metrics may take a while.