Fig. 9
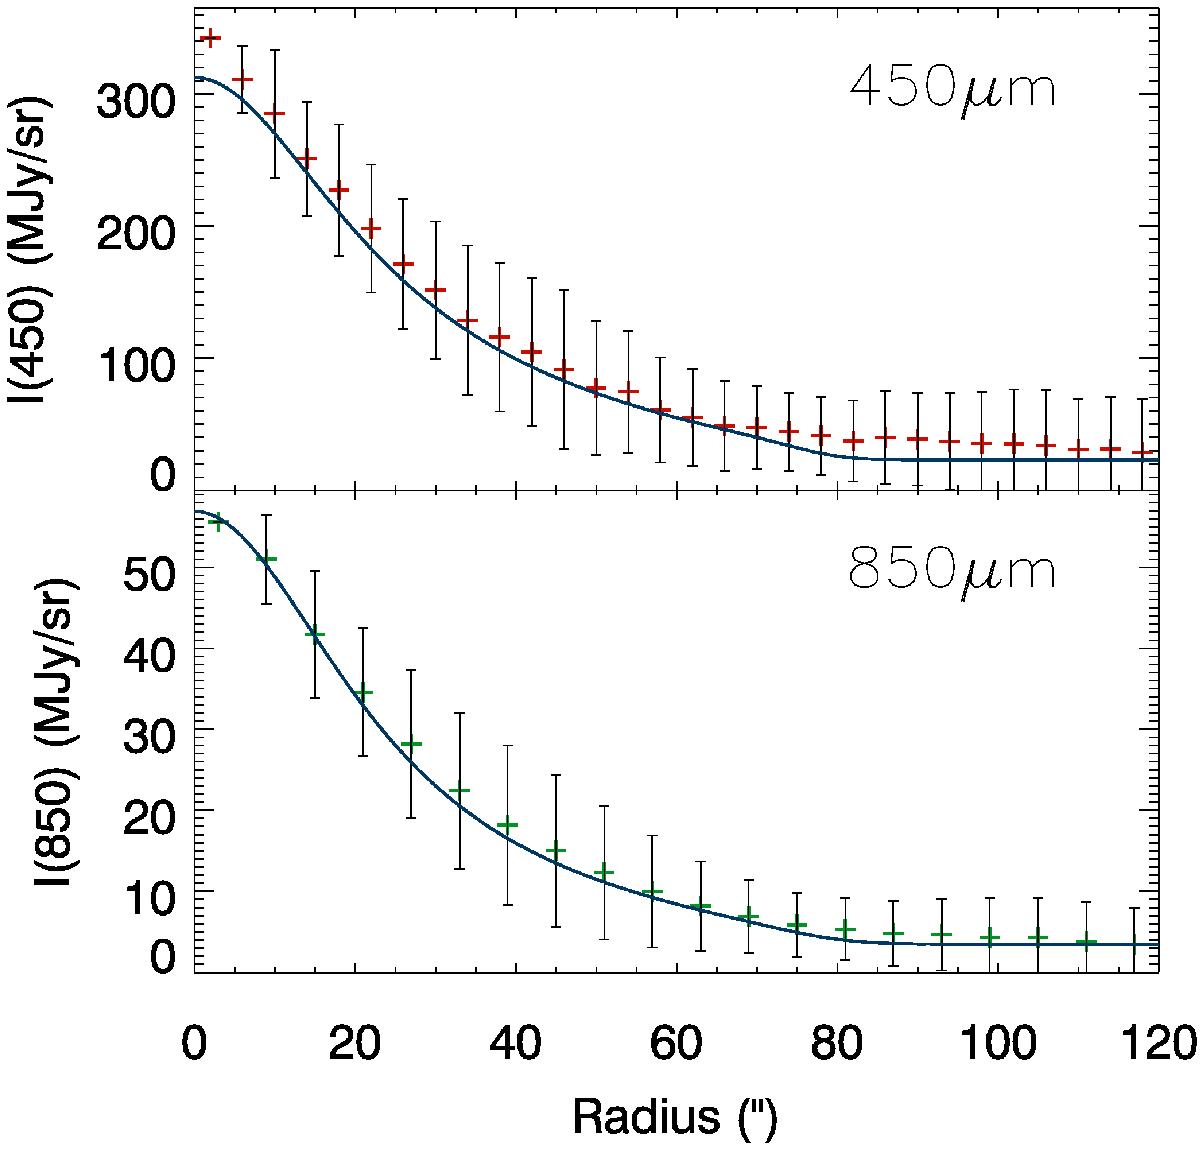
Sub-millimetre intensities as functions of radial distance from the centre of H-MM1. The plus signs with error bars indicate averages over concentric annuli and their standard deviations. These are obtained from SCUBA-2 maps at 450 μm and 850 μm published by Pattle et al. (2015). The solid curves are predictions from the MBES model described in the text and in Fig. 8.
Current usage metrics show cumulative count of Article Views (full-text article views including HTML views, PDF and ePub downloads, according to the available data) and Abstracts Views on Vision4Press platform.
Data correspond to usage on the plateform after 2015. The current usage metrics is available 48-96 hours after online publication and is updated daily on week days.
Initial download of the metrics may take a while.