Fig. A.2
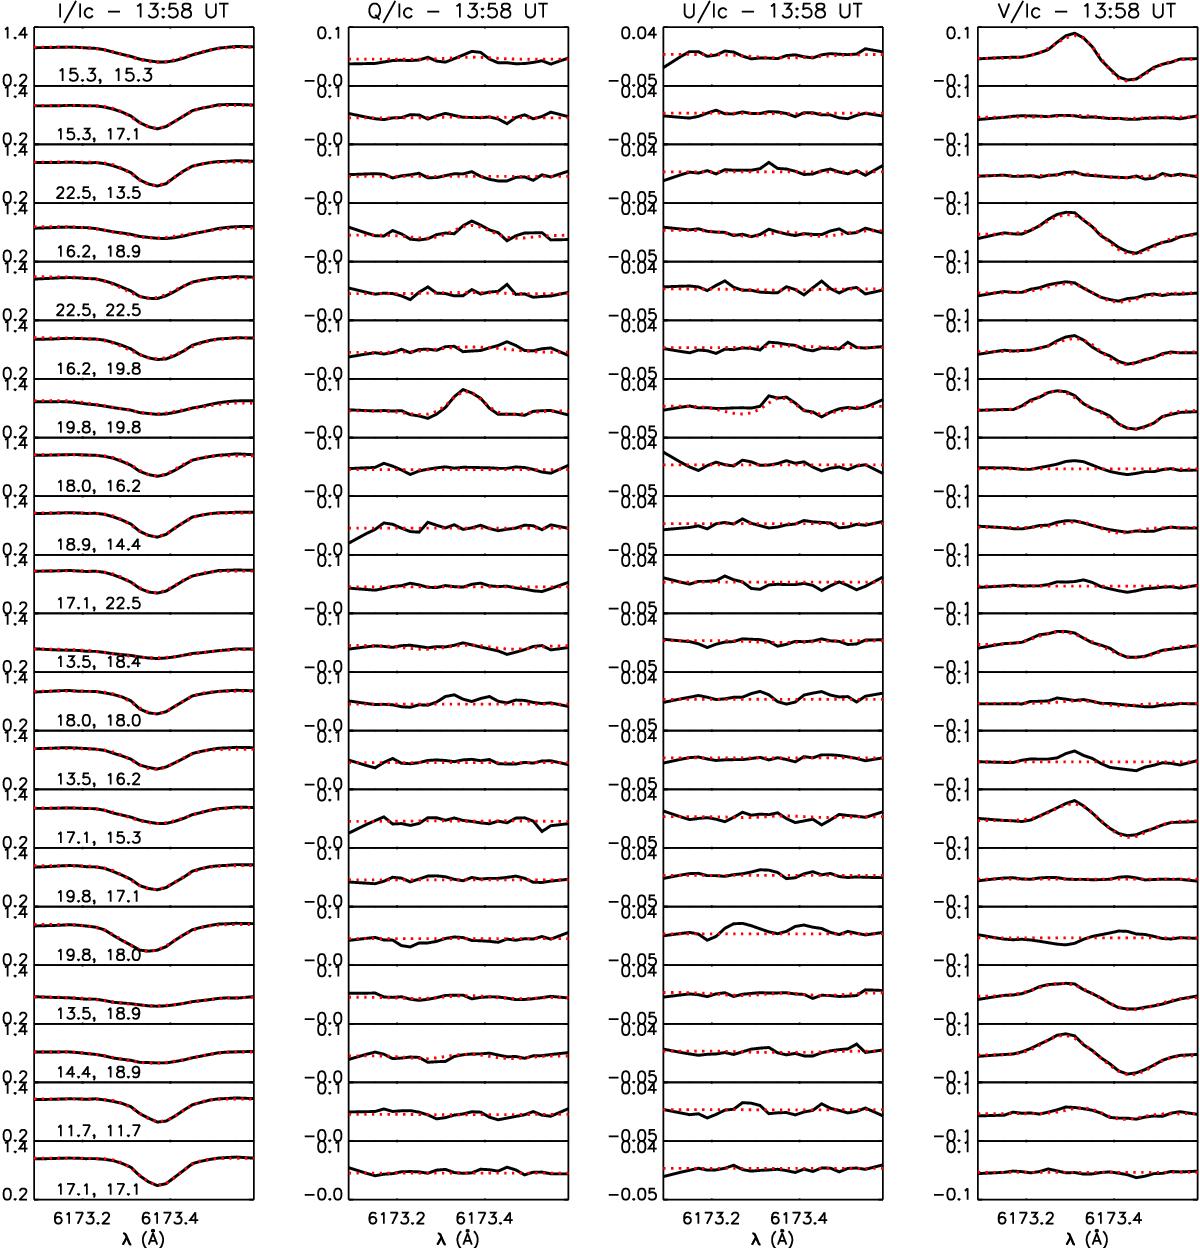
From left to right: examples of observed (black) and inverted (red) Stokes-I, -Q, -U, and -V profiles at the 20 positions on the sub-FOV labelled (a) in Fig. A.1, taken during the pore formation at 13:58 UT. Spectra are normalized to the continuum intensity. Numbers on the bottom left in each sub-panel of the Stokes-I figure indicate the position of the analysed pixel expressed in arcsec with respect to the sub-FOV shown in Fig. A.1. Values of the stray-light fraction, LOS magnetic field strength (kG), field inclination and azimuth (degree), and LOS velocity (km s-1) derived from our data analysis (at optical depth logτ500 = 1) at the same positions of the shown profiles are listed in Table A.1; the values are cut at 2 decimal digits.
Current usage metrics show cumulative count of Article Views (full-text article views including HTML views, PDF and ePub downloads, according to the available data) and Abstracts Views on Vision4Press platform.
Data correspond to usage on the plateform after 2015. The current usage metrics is available 48-96 hours after online publication and is updated daily on week days.
Initial download of the metrics may take a while.