Fig. 7
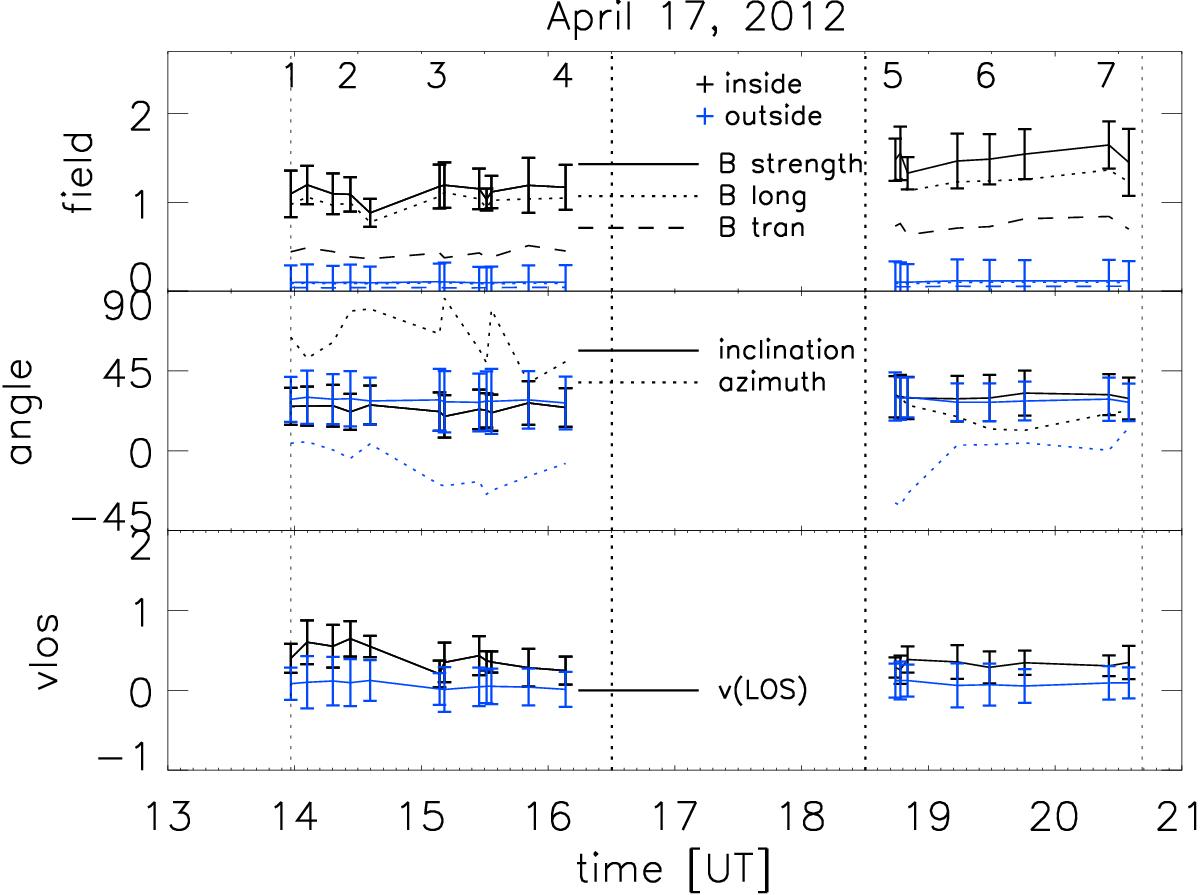
Variation of the magnetic field strength (B strength), transverse (B tran), and longitudinal (B long) components in the LSF (top panel), field inclination, and azimuth in the LSF (middle panel), and LOS plasma velocity vLOS (bottom panel) derived from the IBIS photospheric Fe I 617.3 nm line data during the pore formation, inside (black lines) and outside the evolving feature (blue lines). Each plot shows the mean and standard deviation of the values derived from the data inversion and other methods described in Sect. 2. Field, angle, and velocity values are given in kG, degree, and km s-1 units, respectively. For the sake of clarity, the standard deviation is shown only for magnetic field strength, inclination, and vLOS estimates, inside and around the evolving structure. The vertical dotted lines show the time interval lacking IBIS observations. The numbers in the upper panel indicate the seven times corresponding to the evolutionary stages shown in Figs. 5 and 6.
Current usage metrics show cumulative count of Article Views (full-text article views including HTML views, PDF and ePub downloads, according to the available data) and Abstracts Views on Vision4Press platform.
Data correspond to usage on the plateform after 2015. The current usage metrics is available 48-96 hours after online publication and is updated daily on week days.
Initial download of the metrics may take a while.