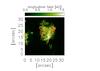
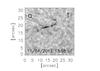
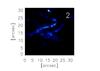
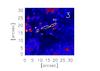
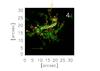
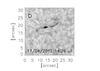
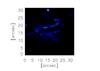
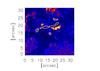
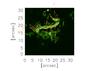
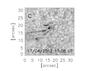
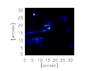
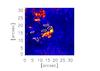
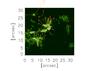
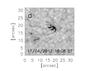
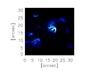
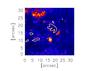
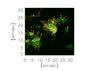
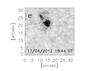
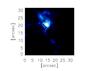
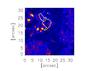
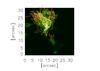
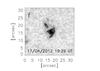
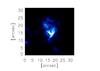
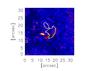
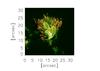
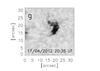
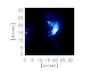
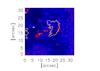
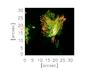
Fig. 5
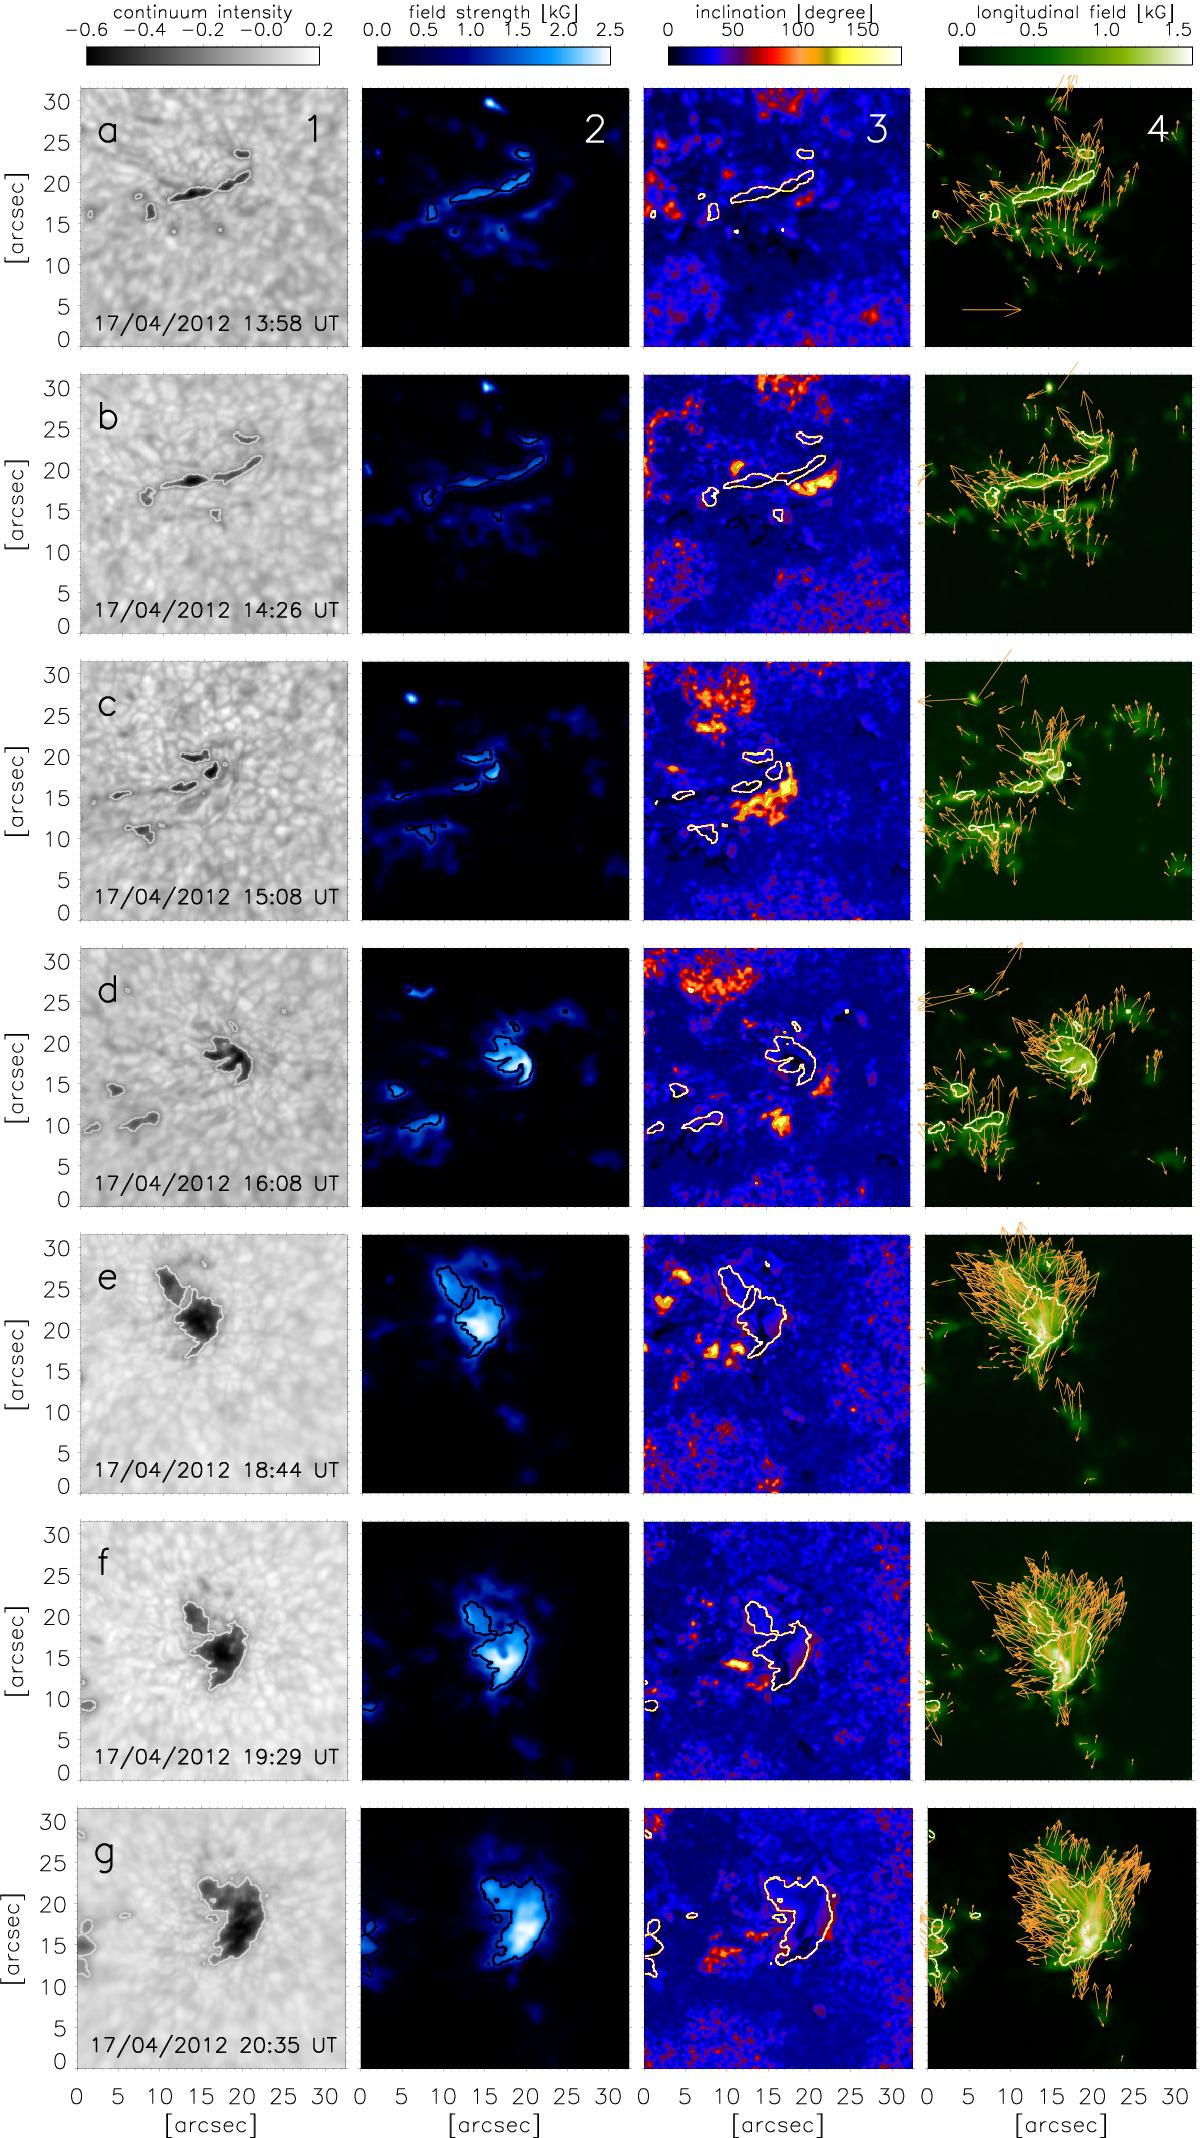
From left to right, top to bottom, numbers and letters within brackets indicate the column and line labels, respectively. Examples of (1) continuum intensity, (2) magnetic field strength, (3) inclination, (4) Bl longitudinal (background image), and Bt transverse (overplotted vector field) components of the magnetic field in the LSF derived from the SIR inversion of the IBIS Fe I 617.3 nm line data, at optical depth logτ500 = 1, at seven stages of the pore formation, at a) 13:58 UT, b) 14:26 UT, c) 15:08 UT, d) 16:08 UT, e) 18:44 UT, f) 19:29 UT, and g) 20:35 UT. North is at the top, and west is to the right. The arrow at the bottom left on panel 4a) represents a horizontal field of 1 kG; transverse field components lower than 0.2 kG are not shown. The contour line in each panel shows the location of the evolving structure singled out in the continuum data, as specified in Fig. 3.
Current usage metrics show cumulative count of Article Views (full-text article views including HTML views, PDF and ePub downloads, according to the available data) and Abstracts Views on Vision4Press platform.
Data correspond to usage on the plateform after 2015. The current usage metrics is available 48-96 hours after online publication and is updated daily on week days.
Initial download of the metrics may take a while.