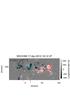
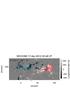
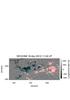
Fig. 4
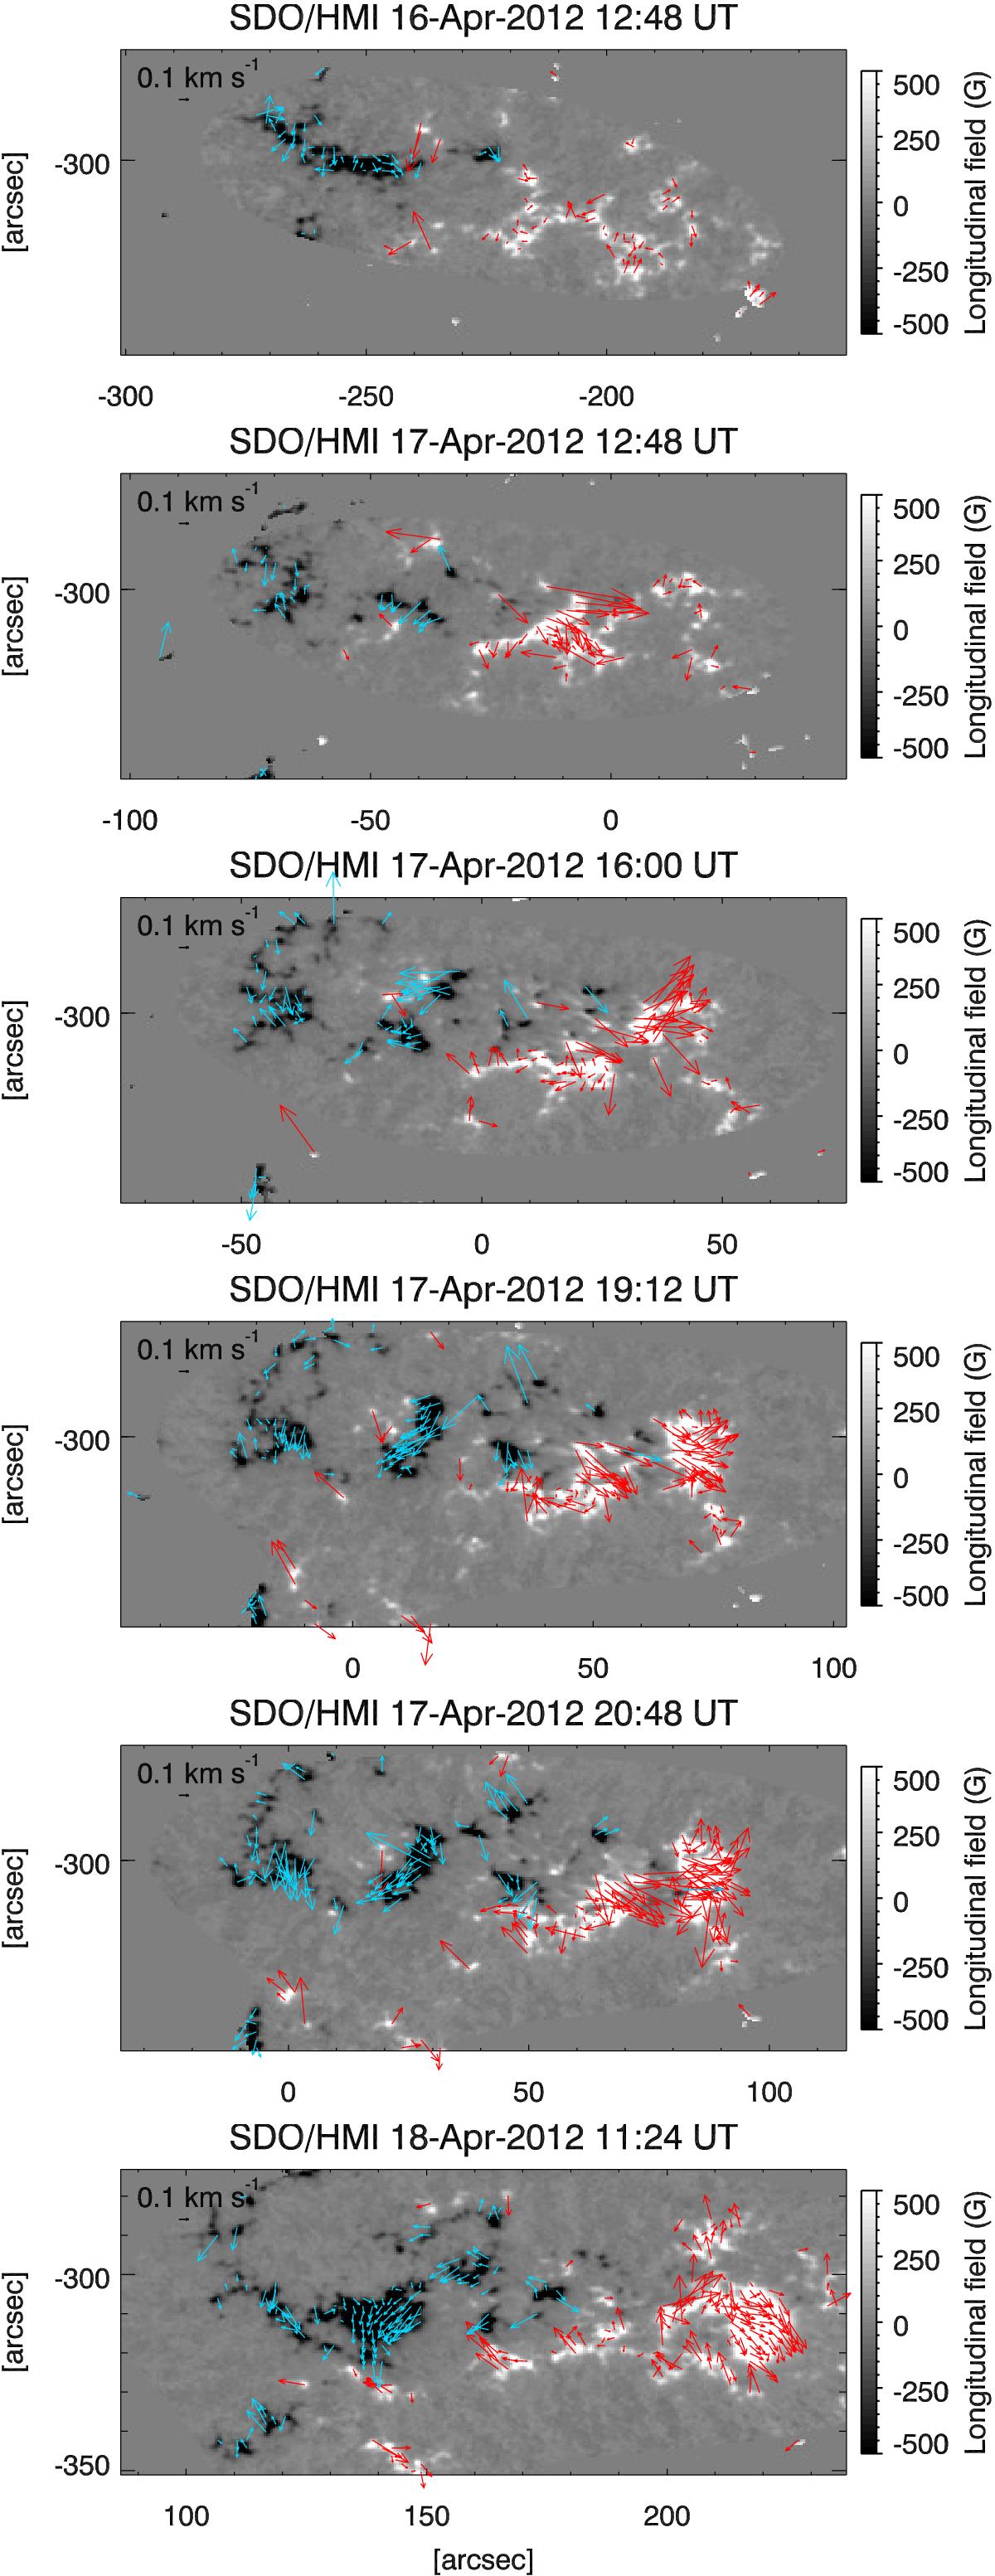
Examples of the photospheric horizontal velocity maps derived from the SDO/HMI SHARP data taken from Apr. 16, 2012, 12:48 UT to Apr. 18, 2012, 11:24 UT, which is from 24 h before the start of the pore formation to several hour after. The arrows indicate the horizontal velocity; red (light blue) shows the leading (trailing), positive (negative) polarity. In all panels but the first, the studied pore coincides with the largest size structure in the leading region. The magnetic field in the background magnetogram is shown in the range of values specified in the colour bars. The full temporal evolution of all computed maps is shown in a movie available online.
Current usage metrics show cumulative count of Article Views (full-text article views including HTML views, PDF and ePub downloads, according to the available data) and Abstracts Views on Vision4Press platform.
Data correspond to usage on the plateform after 2015. The current usage metrics is available 48-96 hours after online publication and is updated daily on week days.
Initial download of the metrics may take a while.