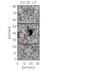
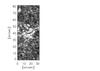
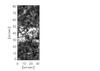
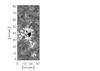
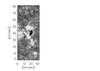
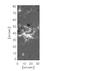
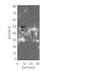
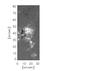
Fig. 3
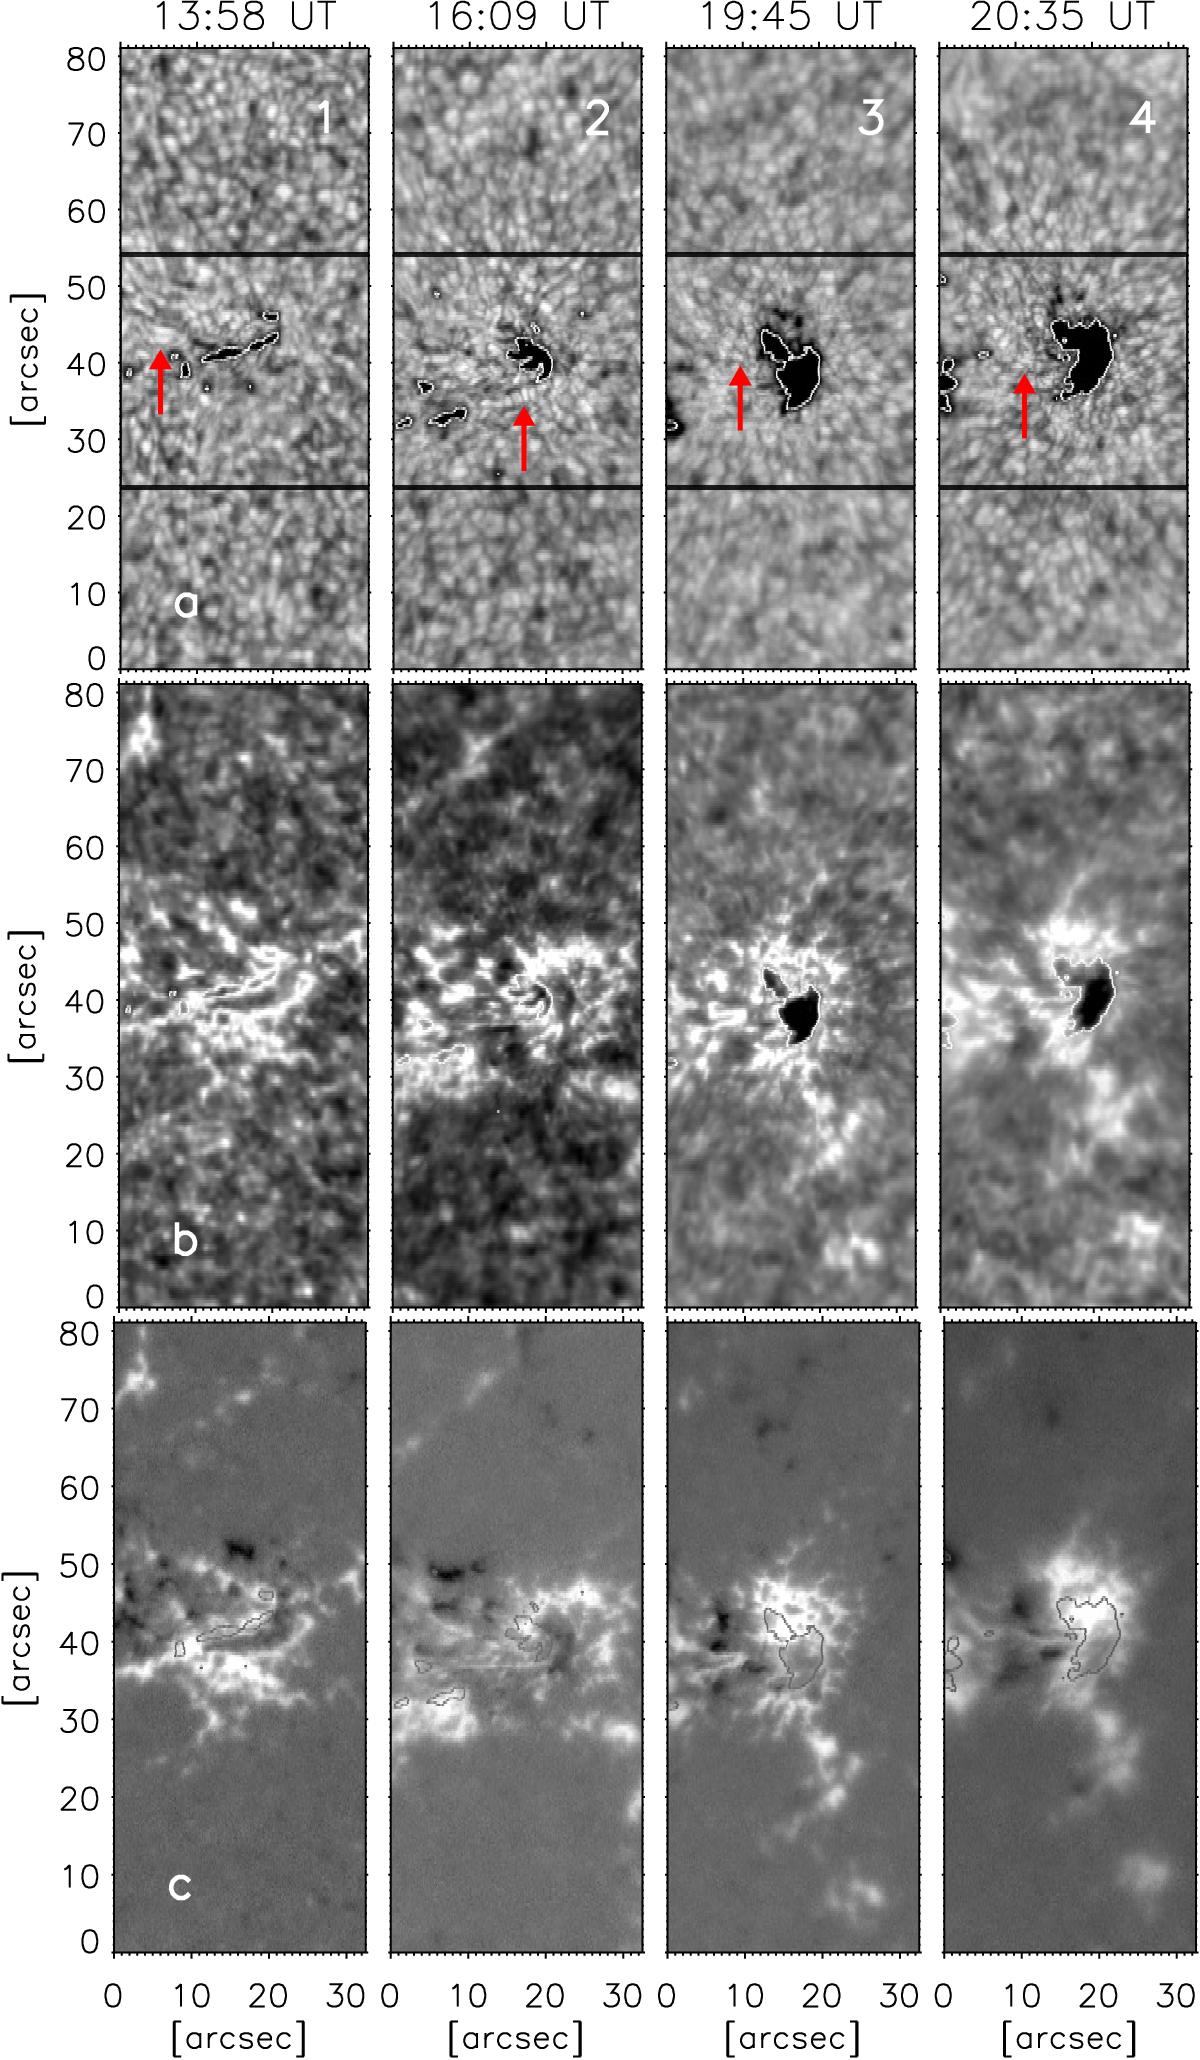
Examples of the IBIS Fe I 617.3 nm line data analysed in our study; letters (numbers) between brackets indicate the line (column) label. a) Stokes I in the continuum near the line, b) Stokes I in the line core, c) Stokes V in the blue wing, near the line core, at four stages of pore evolution, from data taken at (1) 13:58 UT, (2) 16:09 UT, (3) 19:45 UT, and (4) 20:35 UT. North (west) is at the top (right). The black box in the top panels shows the subfield inverted with the SIR code and shown in Figs. 5 and 6. The contours overplotted in each panel indicate the location of the evolving structure, as singled out by applying an intensity threshold criterion, Ic< 0.9Iqs, where Iqs is the average quiet Sun intensity. More details are provided in Sect. 3.1.

Current usage metrics show cumulative count of Article Views (full-text article views including HTML views, PDF and ePub downloads, according to the available data) and Abstracts Views on Vision4Press platform.
Data correspond to usage on the plateform after 2015. The current usage metrics is available 48-96 hours after online publication and is updated daily on week days.
Initial download of the metrics may take a while.