Fig. 2
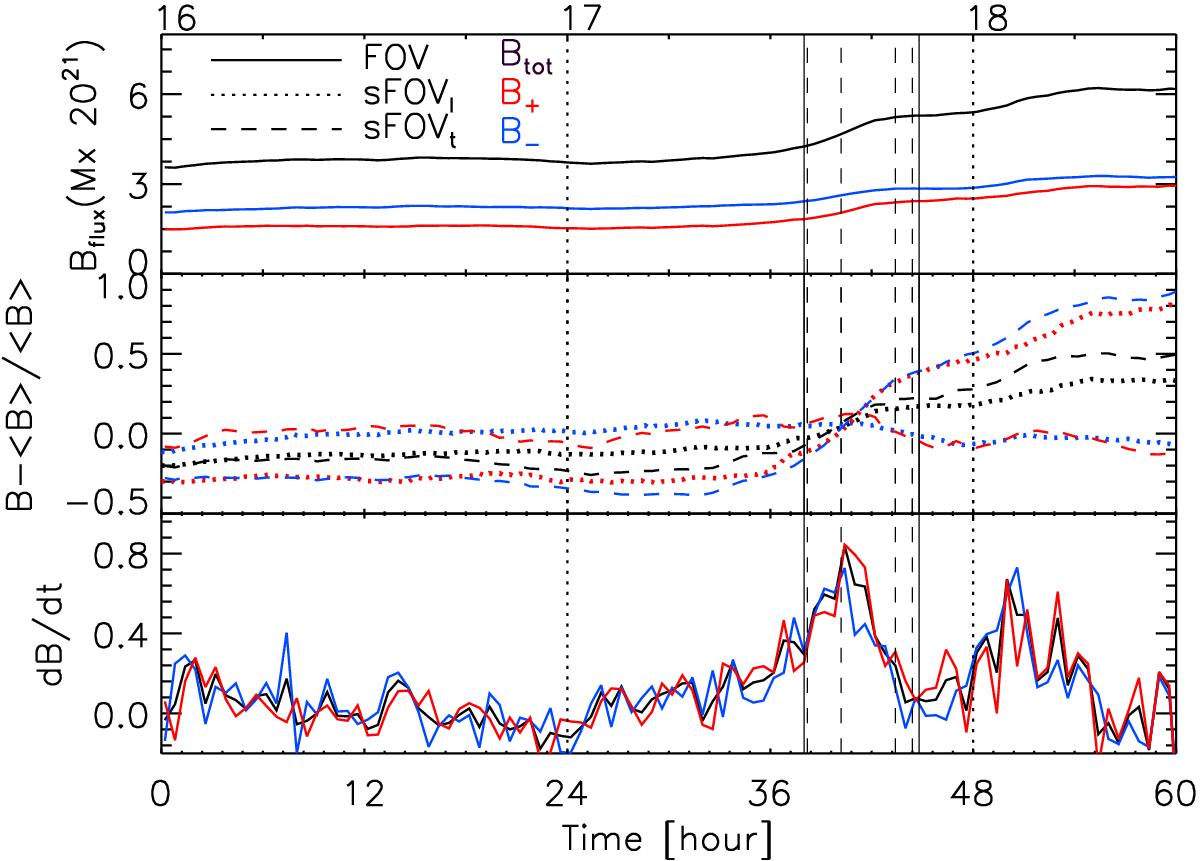
Evolution of the magnetic flux (top, middle) and flux derivative (bottom) in AR 11462 from the SDO/HMI LOS magnetograms acquired from April 16, 2012, 00:00 UT, to April 18, 2012, 12:00 UT, by analysing the subfield shown in Figs. 1 (solid line), and the leading and trailing parts of the same subfield separately (dotted and dashed lines, respectively). The black, red, and blue lines indicate the total, positive, and negative magnetic flux, respectively. The vertical lines show the time interval of the IBIS observations (solid), the times the data shown in Fig. 3 were taken (dashed), and the times of 00:00 UT from April 16 to April 18, 2012 (dotted). The additional axis indicates calendar days at 00:00 UT. For clarity, flux values are only shown from data taken with a cadence of 36 min.
Current usage metrics show cumulative count of Article Views (full-text article views including HTML views, PDF and ePub downloads, according to the available data) and Abstracts Views on Vision4Press platform.
Data correspond to usage on the plateform after 2015. The current usage metrics is available 48-96 hours after online publication and is updated daily on week days.
Initial download of the metrics may take a while.