| Issue |
A&A
Volume 599, March 2017
|
|
|---|---|---|
| Article Number | L1 | |
| Number of page(s) | 4 | |
| Section | Letters | |
| DOI | https://doi.org/10.1051/0004-6361/201630346 | |
| Published online | 20 February 2017 | |
Spectral and rotational properties of near-Earth asteroid (162173) Ryugu, target of the Hayabusa2 sample return mission⋆
1 LESIA – Observatoire de Paris, PSL Research University, CNRS, Sorbonne Universités, UPMC Univ. Paris 06, Univ. Paris Diderot, Sorbonne Paris Cité, 5 place Jules Janssen, 92195 Meudon, France
e-mail: davide.perna@obspm.fr
2 Department of Physics and Astronomy, Seoul National University, Gwanak, 151-742 Seoul, Korea
3 Observatório Nacional, R. Gal. José Cristino 77, 20921-400 Rio de Janeiro, Brazil
4 Okayama Astrophysical Observatory, National Astronomical Observatory of Japan, Asakuchi, 719-0232 Okayama, Japan
5 Institute of Space and Astronautical Science, Japan Aerospace Exploration Agency, 3-1-1 Yoshinodai, Chuo-ku, Sagamihara, 252-5210 Kanagawa, Japan
6 Korea Astronomy and Space Science Institute, 776 Daedeokdae-ro, Yuseong-gu, 305-348 Daejeon, Korea
7 Max-Planck-Institut für extraterrestrische Physik, Postfach 1312, Giessenbachstraße, 85741 Garching, Germany
Received: 23 December 2016
Accepted: 23 January 2017
Context. The JAXA Hayabusa2 mission will perform the first ever sample return from a primitive asteroid. The target near-Earth asteroid (162173) Ryugu will be reached in mid-2018 and its samples will be returned to the Earth by the end of 2020.
Aims. We want to improve the current knowledge of the compositional and rotational properties of Ryugu, which are still presenting some uncertainties that might affect the mission operations and scientific return.
Methods. We acquired high-quality photometric time-series data with the FORS2 instrument at the Very Large Telescope of the European Southern Observatory (ESO-VLT, Chile). We also acquired four FORS2 visible spectra and three X-shooter spectra in the 0.35−2.15 μm range, at different rotational phases.
Results. We obtained the currently highest-quality visual light-curve of Ryugu. A best solution of ~7.63 h is found for the rotational period, while a short-period solution (i.e., P ≈ 3.8 h) is ruled out by the clearly non-symmetric light-curve. The obtained spectra are generally similar and featureless, but present a drop-off of the reflectance at <0.45 μm, suggesting the presence of aqueously altered minerals on Ryugu. The best meteorite analogs for Ryugu are represented by thermally altered CM carbonaceous chondrites.
Conclusions. Our new photometric data help to refine the target reference model used by the Hayabusa2 team for the mission preparation and implementation, improving our knowledge of Ryugu’s spin properties. Our new spectra constrain the compositional and geological context of the Ryugu’s surface in order to prepare the planning of mission observations and support the working group for the selection of possible landing and sampling sites.
Key words: minor planets, asteroids: individual: (162173) Ryugu / techniques: spectroscopic / techniques: photometric
© ESO, 2017
1. Introduction
After the success of the Hayabusa mission, which returned to Earth in 2010 with samples of the S-type near-Earth asteroid (NEA) (25143) Itokawa (Fujiwara et al. 2006; Nakamura et al. 2011), the Japan Aerospace Exploration Agency (JAXA) launched the Hayabusa2 mission in December 2014, with arrival at the C-type NEA (162173) Ryugu in July 2018, and return to the Earth of the asteroid samples in December 2020. The Hayabusa2 mission also implements the Small Carry-on Impactor experiment designed to remove the asteroid surface regolith locally and create an artificial crater (Saiki et al. 2016), as well as the German/French (DLR/CNES) compact landing package MASCOT (Mobile Asteroid surface SCOuT), designed to perform in-situ investigations of the surface (Ho et al. 2016).
As a primitive asteroid (with a most likely dynamical origin in the inner main belt; Campins et al. 2013), a sample return mission from Ryugu will provide a better understanding of the origin and evolution of the solar system. In particular, the mission will allow for the investigation of key topics, such as the original organics and water present in the early solar system, as well as the delivery of such materials to the primitive Earth (e.g., Barucci et al. 2012). Unfortunately, the nature of Ryugu still presents some obscure points that could affect the mission operations and limit its scientific return.
First of all, there are uncertainties about the homogeneity of the surface composition of Ryugu. A worldwide observational campaign of this body was carried out during the observational opportunity in 2012. Moskovitz et al. (2013) noticed that there is no detectable rotational variation in the spectra at 0.5−0.9 μm to an accuracy of ~4%. On the contrary, Lazzaro et al. (2013) suggested that there could be differences in the UV wavelength region, showing a spectral drop-off at ~0.4 μm by 10−30%. Hiroi et al. (1996) noticed that, for primitive asteroids, there is a strong correlation between the presence of the UV drop-off and the hydrated silicate absorption around 3 μm. Thus, the spectral variation in Lazzaro et al. (2013) can be explained by a heterogeneity in the surface distribution of hydrated minerals. Noteworthy, this UV/blue absorption (at approximately <0.55 μm), typical of Cg asteroids, had already been detected in the spectrum of Ryugu by Binzel et al. (2001). A further absorption feature related to hydrated minerals at ~0.7 μm was reported by Vilas (2008) but has not been confirmed in any subsequent observation, including those presented in this work. Such a feature is attributed to Fe2 + → Fe3 + charge-transfer transitions in oxidized iron in phyllosilicates. All of these features are due to aqueous alteration (e.g., Rivkin et al. 2002), that is, a chemical alteration of a material by the interaction of that material with water. Aqueous alteration in asteroids may be connected to early aluminium-26 heating, a now decayed short-lived isotope, or to electrical induction heating due to a strong early (T Tauri phase) solar wind. For the sake of proper Hayabusa2 mission planning, it is important to confirm the presence of aqueously-altered material on particular regions of Ryugu. Indeed, their presence would put constraints on the thermal history of the asteroid, helping to put the samples to be analyzed in Earth laboratories after the end of the mission in the right scientific context. If the UV drop-off or the 0.7 μm feature are confirmed for some regions on the surface, this has a major impact on the multi-sampling strategy of Hayabusa2 (e.g., one sample could be collected from a hydrated silicate-rich area and another from a hydrated silicate-poor area).
A further uncertainty that may strongly affect the mission planning is related to the rotational properties of Ryugu. Indeed, the current best solution for the rotational period of this asteroid is P ~ 7.63 h, assuming a double-peaked light-curve (Kim et al. 2013; Müller et al. 2017). However, a single-peaked light-curve is also to be taken into account (i.e., P ≈ 3.8 h), and the quality of the available data (from telescopes of the 2-m class) after the 2007 and 2012 observing opportunities is not good enough to exclude different solutions. Moreover, a large ambiguity is currently represented by the pole orientation of Ryugu, as the inversion of the available (visual and thermal) light-curves cannot provide definitive solutions (Müller et al. 2017). New light-curves acquired during the 2016 observational opportunity, under viewing geometries complementary with those of the 2007 and 2012 campaigns, will permit improvement of the current inversion models and put stronger constraints on the spin orientation of Ryugu. Clearly, a good determination of the rotational period and axis orientation of the target is fundamental to correctly plan the operations of the Hayabusa2 space mission well in advance of the arrival at the asteroid.
In order to improve our knowledge of its rotational and compositional properties, we acquired new photometric and spectroscopic observations of Ryugu at the Very Large Telescope of the European Southern Observatory (ESO-VLT), using the FORS2 and X-shooter instruments.
2. Observations and data reduction
2.1. FORS2
Ryugu was observed with FORS2 (Appenzeller et al. 1998) on 12 July 2016. Photometric data were acquired over approximately 8.4 h (≈1:20−9:45 UT) in the V band using exposure times of 10−90 s. Data reduction was carried out using ESO pipelines for basic corrections (bias subtraction, flat calibration, etc.), while Ryugu’s flux was measured by the aperture photometry task (apphot) of the IRAF package, with a typical integrating radius approximately four times the average seeing. The magnitude calibration was obtained by means of the observation of several Landolt (1992) standard fields.
In spectroscopic mode, we used the 300V grism and the GG435 sorting filter, covering the spectral range 0.445−0.87 μm. The observations were performed orienting the slit (2′′) along the parallactic angle to minimize the effects of atmospheric differential refraction. Ryugu was observed four times during the night (cf. Table 1). The spectra were reduced in a standard way with IRAF: bias removal, flat-fielding, and wavelength calibration using He-Hg-Cd-Ar lines. The spectra were then extracted, corrected for atmospheric extinction, and normalized to unity at 0.55 μm. The reflectance spectra of Ryugu were obtained by dividing its spectra by that of the well-proven solar analog star HD 147284, observed at airmass 1.14 (several other calibration stars were observed during the night and used during data reduction to check for the consistency of our results).
Observational circumstances.
2.2. X-shooter
Ryugu was observed with X-shooter (Vernet et al. 2011) on 11 August 2016, allowing us to simultaneously record the spectrum from 0.35 up to 2.15 μm, separated into three arms: UVB, VIS, and NIR (the slit widths used were 1.3′′, 1.2′′, and 1.2′′, respectively). The observations were carried out by nodding along the slit in the usual ABBA pattern. Ryugu was observed three times during the night (cf. Table 1), orienting the slit along the parallactic angle. All data were reduced using Reflex v2.41, which automatically performs all calibrations and corrections in each arm (bias or dark current correction, flat-fielding, distortion correction, wavelength calibration, extinction correction, sky extraction, and creation of a 2D image with the spectrum). We then extracted the spectra using IRAF, one per arm, and divided those of Ryugu by those of the well-proven solar analog SA110-361 (observed at airmass 1.29), also used to correct for telluric absorptions in the near-infrared (we verified to obtain consistent results using also the G2V star HIP 96379, observed at airmass 1.17). Finally we combined the UVB, VIS, and NIR spectra, thanks to the overlap between the three arms, to produce the final spectra of Ryugu (normalized to unity at 0.55 μm).
3. Data analysis and results
3.1. Light-curve
The obtained light-curve of Ryugu clearly shows a double-peaked behavior (Fig. 1). We derived the rotational period using the generalized Lomb-Scargle (GLS) periodogram method (Zechmeister & Kürster 2009), finding the best solution for P ~ 7.63 h (Fig. 2). Figure 1 presents the data folded with this best-fit period, and 3D shape models of Ryugu (Müller et al. 2017) assuming the most likely axis orientation of (λ,β)ecl = (340°, −40°), in correspondence with the rotational phases at the moment of spectral observations (cf. Table 1). It is noteworthy that, assuming the above rotation axis orientation, FORS2 observations were performed under an aspect angle of 121° (111° for X-shooter observations), that is, we were mostly looking at the Southern hemisphere of Ryugu.
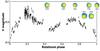 |
Fig. 1 Light-curve of Ryugu, folded with a synodic period of 7.63 h. The zeropoint is at 57581.0 MJD. 3D shape models of Ryugu were derived from Müller et al. (2017) for the mid-exposure time of spectral observations (color code corresponds to different solar insolations, with dark blue being the minimum and yellow being the maximum, in the range ~0−700 W/m2). |
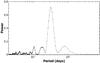 |
Fig. 2 The GLS periodogram of Ryugu. The highest peak corresponds to a rotational period of ~7.63 h. |
3.2. Spectra
The final spectra of Ryugu obtained with the FORS2 and X-shooter instruments are presented in Figs. 3 and 4, respectively.
To check for their consistency, we computed the spectral slope in the range 0.5−0.8 μm by a linear fit to the data. For each spectrum, we ran 100 fits on randomly selected sub-samples of the data points; in Table 1, we report the median values of our measurements, together with the maximum errors, which also take into account the uncertainty introduced by the use of different solar analogs. It is difficult to establish whether the observed spectral variations are due to small heterogeneities on the surface or to some minor atmospheric/instrumental/reduction issues.
None of the spectra present the 0.7-μm band. X-shooter spectra show a marginal drop-off of the reflectance (~10%, compared to data uncertainty of ~5%) at the blue end (<0.45 μm). The NIR part of the spectra is featureless and slightly red, in good agreement with the only two NIR spectra of Ryugu available in the literature (Abe et al. 2008; Pinilla-Alonso et al. 2013).
Looking for the best meteorite analogs of Ryugu, the chi-square method was used through the M4AST online tool (Popescu et al. 2012) to compare our X-shooter spectra with those included in the RELAB database (Pieters & Hiroi 2004). We visually inspected the 30 best matches proposed by the tool over the several thousands of sample spectra in RELAB, to compare the asteroid and meteorite spectral features. We found that most of the best fitting meteorites are unusual/heated CM and CI carbonaceous chondrites, in agreement with Moskovitz et al. (2013) and Sugita et al. (2013). In particular, the best-fit spectra for our X-shooter data are represented by samples of the CM carbonaceous chondrite Murchison, heated in the laboratory to 900−1000 °C (cf. Fig. 4). Such meteorite samples also present a visible albedo comparable with that of Ryugu (~6%, cf. Müller et al. 2017, and references therein).
In addition, we used the M4AST tool to classify our spectra within the taxonomic scheme by DeMeo et al. (2009), and found that Ryugu falls in the C-type group.
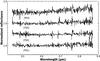 |
Fig. 3 FORS2 reflectance spectra of Ryugu, shifted by 0.25 for clarity. |
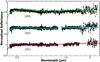 |
Fig. 4 X-shooter reflectance spectra of Ryugu, shifted by 0.8 for clarity. Regions affected by strong atmospheric absorption (at ≈1.4 μm and ≈1.9 μm) have been cut out. Superimposed are the spectra of thermally altered samples of the CM carbonaceous chondrite Murchison, heated at 900 °C (in red, RELAB file cfmb64) and 1000 °C (in cyan and green, RELAB file cgmb64). |
4. Summary and conclusions
The light-curve we obtained with the FORS2 instrument at ESO-VLT is clearly double-peaked, and the best rotational period corresponds to ~7.63 h. A single-peaked, short-period (i.e., P ≈ 3.8 h) light-curve can be safely excluded after our observations.
We note that our new high-quality photometric data – combined with previously acquired visual light-curves and thermal data – will help to refine the reference solutions for the rotational period and the pole orientation (Müller et al. 2017) currently used by the Hayabusa2 team for the best planning of the mission operations around Ryugu.
We obtained seven spectra of Ryugu at ESO-VLT; four in the 0.445−0.87 μm range with FORS2 and three in the 0.35−2.15 μm range with the X-shooter instrument. Our spectra cover approximately 60% of the rotational period and show a slight variability of the visible spectral slope, which may be due to small heterogeneities on the surface or just to observational and/or reduction artefacts. None of the spectra present the 0.7-μm feature, but the reflectance drop-off of X-shooter spectra at <0.45 μm suggest the presence of aqueously altered material on the surface.
Our X-shooter data represent the first ever spectral dataset of Ryugu acquired with the same observational conditions for the whole wavelength range, and have been compared with
laboratory spectra of meteorites, finding that the best matches to Ryugu (in terms of albedo and spectral shape) are represented by thermally altered CMs. However, one should recall that it is difficult to establish spectral parameters that clearly distinguish thermally altered CMs from unheated (water-rich, aqueously altered) CMs (Cloutis et al. 2012). In addition, our collection of carbonaceous chondrite meteorites likely under-represents the whole diversity of carbonaceous asteroid spectra, in consideration of the high friability of such material during atmospheric entry (e.g., Borovička et al. 2015).
While our new data help to shed light on physical properties of Ryugu that are important for the Hayabusa2 mission preparation and execution, the asteroid samples that will be returned to the Earth will allow us to identify and characterize in detail the organics and minerals present on Ryugu, and will help to better establish the “ground truth” for Earth-based observations of primitive asteroids.
Acknowledgments
We thank our referee, Humberto Campins, for his positive reception and valuable comments. This work is supported by the French CNES (Centre national d’études spatiales). D.P. acknowledges financial support from the NEOShield-2 project, funded by the European Commission’s Horizon 2020 program (contract No. PROTEC-2-2014-640351). M.I. was supported by the National Research Foundation of Korea (NRF) funded by the Ministry of Education (NRF-2015R1D1A1A01060025). A.A.C. acknowledges funding from CNPq and FAPERJ. D.K. is supported by the Optical & Near-infrared Astronomy Inter-university Cooperation Program, the MEXT of Japan. M.J.K. and D.G.R. were supported by KASI (Korea Astronomy and Space Science Institute) grant 2017-1-854-00 (Project: OWL-NET Operation & application). S.H. was supported by the Hypervelocity Impact Facility (former facility name: the Space Plasma Laboratory), ISAS, JAXA. T.M. acknowledges funding from the European Union’s Horizon 2020 Research and Innovation Programme, under Grant Agreement No. 687378.
References
- Abe, M., Kawakami, K., Hasegawa, S., et al. 2008, LPI, 39, 1594 [NASA ADS] [Google Scholar]
- Appenzeller, I., Fricke, K., Fürtig, W., et al. 1998, ESO Messenger, 94, 1 [Google Scholar]
- Barucci, M. A., Cheng, A. F., Michel, P., et al. 2012, Exp. Astron., 33, 645 [NASA ADS] [CrossRef] [Google Scholar]
- Binzel, R. P., Harris, A. W., Bus, S. J., & Burbine, T. H. 2001, Icarus, 151, 139 [NASA ADS] [CrossRef] [Google Scholar]
- Borovička, J., Spurný, P., & Brown, P. 2015, in Asteroids IV, eds. P. Michel, F. E. DeMeo, & W. F. Bottke (Tucson: Univ. of Arizona Press), 257 [Google Scholar]
- Campins, H., de León, J., Morbidelli, A., et al. 2013, AJ, 146, 26 [NASA ADS] [CrossRef] [Google Scholar]
- Cloutis, E. A., Hudon, P., Hiroi, T., & Gaffey, M. J. 2012, Icarus, 220, 586 [NASA ADS] [CrossRef] [Google Scholar]
- DeMeo, F. E., Binzel, R. P., Slivan, S. M., & Bus, S. J. 2009, Icarus, 202, 160 [NASA ADS] [CrossRef] [Google Scholar]
- Fujiwara, A., Kawaguchi, J., Yeomans, D. K., et al. 2006, Science, 312, 1330 [NASA ADS] [CrossRef] [PubMed] [Google Scholar]
- Hiroi, T., Zolensky, M. E., Pieters, C. M., et al. 1996, Meteor. Planet. Sci., 31, 321 [NASA ADS] [CrossRef] [Google Scholar]
- Ho, T.-Mi, Baturkin, V., Grimm, C., et al. 2016, Space Sci. Rev., in press DOI: 10.1007/s11214-016-0251-6 [Google Scholar]
- Kim, M.-J., Choi, Y. J., Moon, H. K., et al. 2013, A&A, 550, L11 [NASA ADS] [CrossRef] [EDP Sciences] [Google Scholar]
- Landolt, A. U. 1992, AJ, 104, 340 [NASA ADS] [CrossRef] [Google Scholar]
- Lazzaro, D., Barucci, M. A., Perna, D., et al. 2013, A&A, 549, L2 [NASA ADS] [CrossRef] [EDP Sciences] [Google Scholar]
- Moskovitz, N. A., Abe, S., Pan, K.-S., et al. 2013, Icarus, 224, 2 [NASA ADS] [CrossRef] [Google Scholar]
- Müller, T. G., Durech, J., Ishiguro, M., et al. 2017, A&A, in press DOI: 10.1051/0004-6361/201629134 [Google Scholar]
- Nakamura, T., Noguchi, T., Tanaka, M., et al. 2011, Science, 333, 1113 [NASA ADS] [CrossRef] [Google Scholar]
- Pieters, C. M., & Hiroi, T. 2004, 35th Lunar and Planetary Science Conf., March 15–19, 2004 35, 1720 [Google Scholar]
- Pinilla-Alonso, N., Lorenzi, V., Campins, H., et al. 2013, A&A, 552, A79 [NASA ADS] [CrossRef] [EDP Sciences] [Google Scholar]
- Popescu, M., Birlan, M., & Nedelcu, D. A. 2012, A&A, 544, A130 [NASA ADS] [CrossRef] [EDP Sciences] [Google Scholar]
- Rivkin, A. S., Howell, E. S., Vilas, F., & Lebofsky, L. A. 2002, in Asteroids III, eds. W. F. Bottke Jr., A. Cellino, P. Paolicchi, & R. P. Binzel (Tucson: Univ. of Arizona Press), 235 [Google Scholar]
- Saiki, T., Imamura, H., Arakawa, M., et al. 2016, Space Sci. Rev., in press DOI: 10.1007/s11214-016-0297-5 [Google Scholar]
- Sugita, S., Kuroda, D., Kameda, S., et al. 2013, LPI, 44, 2591 [NASA ADS] [Google Scholar]
- Vernet, J., Dekker, H., D’Odorico, S., et al. 2011, A&A, 536, A105 [NASA ADS] [CrossRef] [EDP Sciences] [Google Scholar]
- Vilas, F. 2008, AJ, 135, 110 [NASA ADS] [CrossRef] [Google Scholar]
- Zechmeister, M., & Kürster, M. 2009, A&A, 496, 577 [NASA ADS] [CrossRef] [EDP Sciences] [Google Scholar]
All Tables
All Figures
|
Fig. 1 Light-curve of Ryugu, folded with a synodic period of 7.63 h. The zeropoint is at 57581.0 MJD. 3D shape models of Ryugu were derived from Müller et al. (2017) for the mid-exposure time of spectral observations (color code corresponds to different solar insolations, with dark blue being the minimum and yellow being the maximum, in the range ~0−700 W/m2). |
| In the text | |
|
Fig. 2 The GLS periodogram of Ryugu. The highest peak corresponds to a rotational period of ~7.63 h. |
| In the text | |
|
Fig. 3 FORS2 reflectance spectra of Ryugu, shifted by 0.25 for clarity. |
| In the text | |
|
Fig. 4 X-shooter reflectance spectra of Ryugu, shifted by 0.8 for clarity. Regions affected by strong atmospheric absorption (at ≈1.4 μm and ≈1.9 μm) have been cut out. Superimposed are the spectra of thermally altered samples of the CM carbonaceous chondrite Murchison, heated at 900 °C (in red, RELAB file cfmb64) and 1000 °C (in cyan and green, RELAB file cgmb64). |
| In the text | |
Current usage metrics show cumulative count of Article Views (full-text article views including HTML views, PDF and ePub downloads, according to the available data) and Abstracts Views on Vision4Press platform.
Data correspond to usage on the plateform after 2015. The current usage metrics is available 48-96 hours after online publication and is updated daily on week days.
Initial download of the metrics may take a while.