Fig. 1
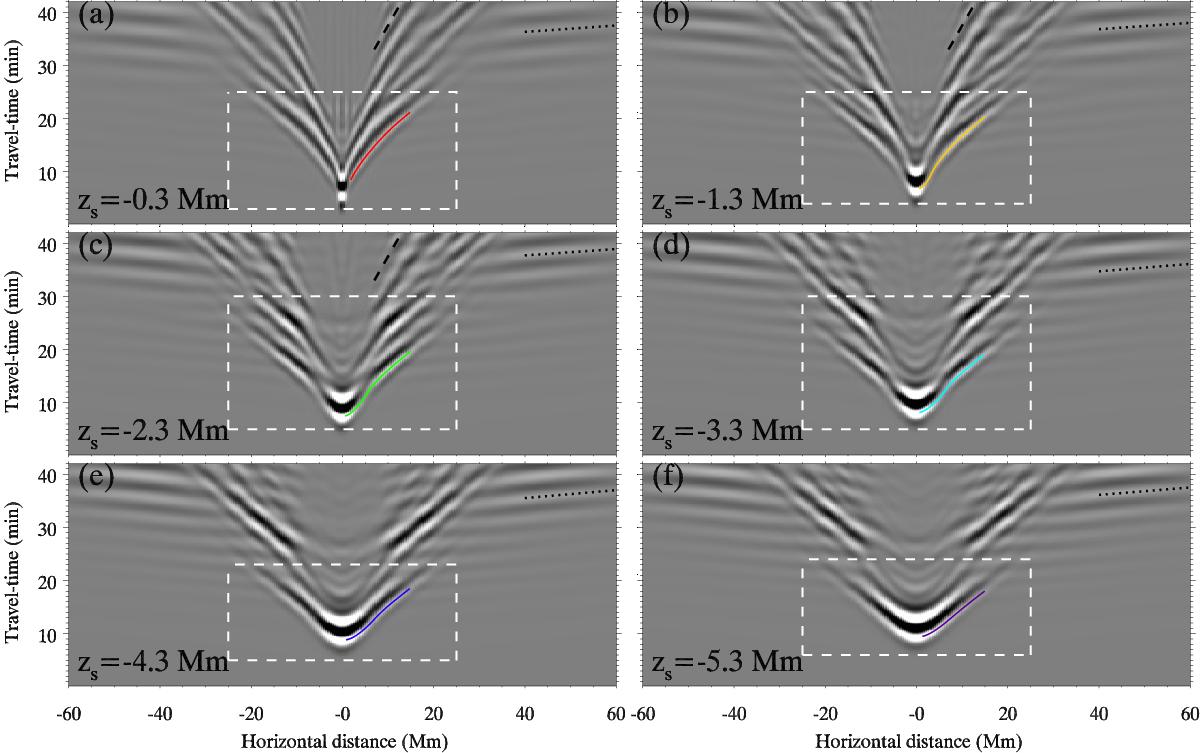
Time-distance diagrams at log τ = −2 for the simulations containing waves driven by a single source located at the center of the sunspot. Each panel corresponds to a different source depth: zs = −0.3 Mm (a), zs = −1.3 Mm (b), zs = −2.3 Mm (c), zs = −3.3 Mm (d), zs = −4.3 Mm (e), and zs = −5.3 Mm (f). Color lines illustrate the track of the fast-moving waves. Dotted lines in the top right part of all panels show a linear fit of the reflected fast wave. Dashed lines in panels a)−c) show a linear fit of the helioseismic waves. Dashed white boxes delimit the first wavefronts of the fast-moving wave.
Current usage metrics show cumulative count of Article Views (full-text article views including HTML views, PDF and ePub downloads, according to the available data) and Abstracts Views on Vision4Press platform.
Data correspond to usage on the plateform after 2015. The current usage metrics is available 48-96 hours after online publication and is updated daily on week days.
Initial download of the metrics may take a while.