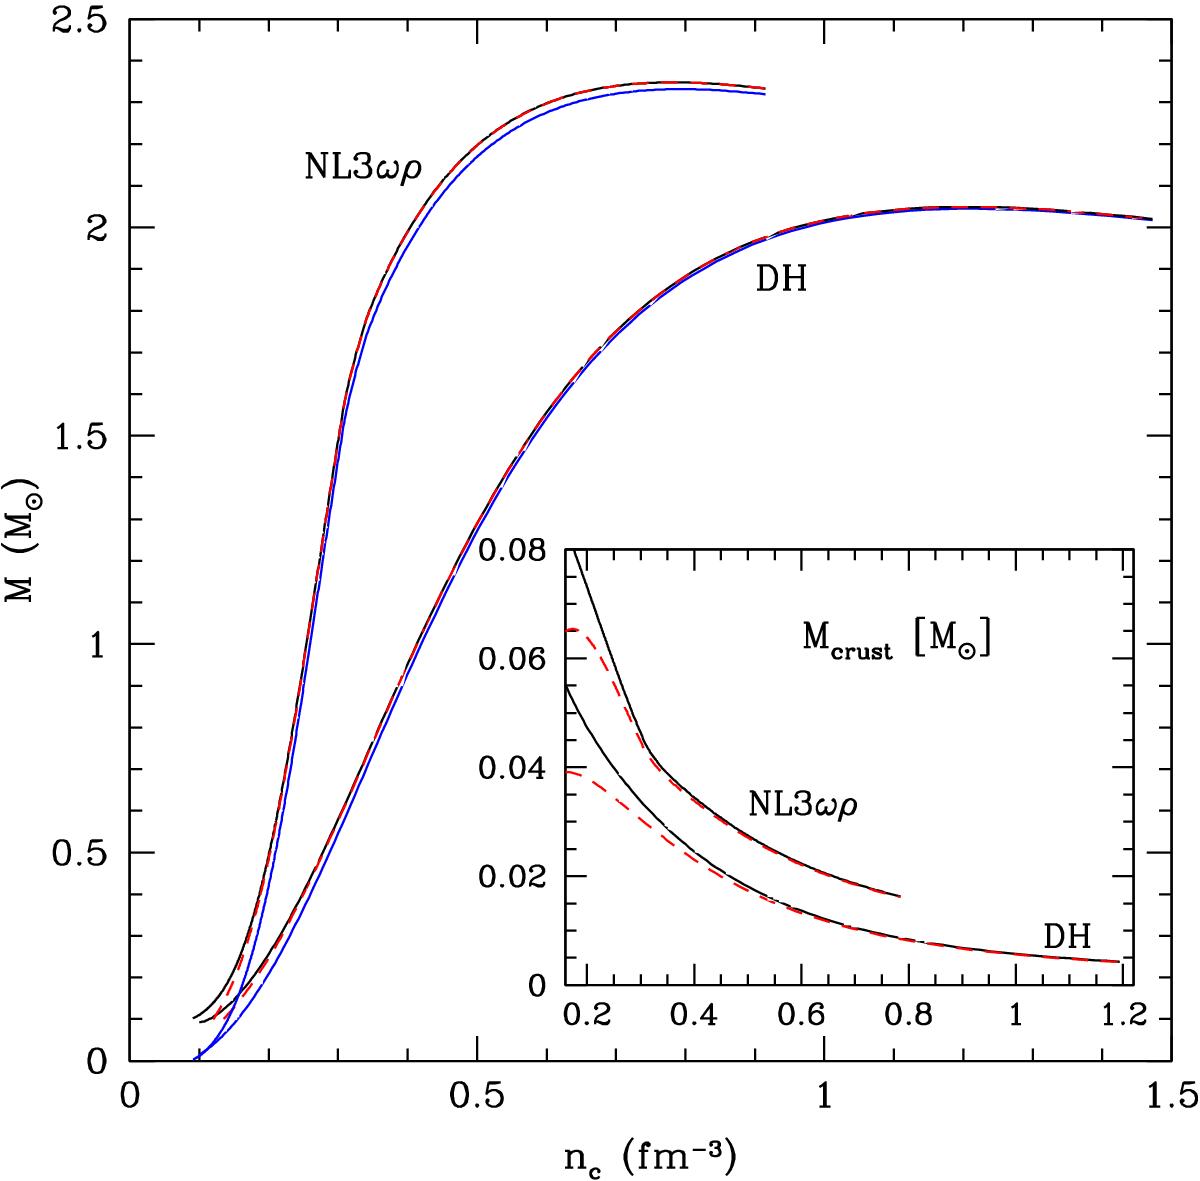
Fig. 2

NS mass M and mass of the crust Mcrust (inset) for the DH and NL3ωρ EOS as a function of the baryon central density nc. Solid black curves indicate the exact solution calculated for the unified EOS (including the crust EOS), blue curves indicate the mass of the core (P>Pcc), and dashed (red) lines indicate the approximation based on Eq. (19), which were obtained using the core EOS alone.
Current usage metrics show cumulative count of Article Views (full-text article views including HTML views, PDF and ePub downloads, according to the available data) and Abstracts Views on Vision4Press platform.
Data correspond to usage on the plateform after 2015. The current usage metrics is available 48-96 hours after online publication and is updated daily on week days.
Initial download of the metrics may take a while.


