Free Access
Fig. 9
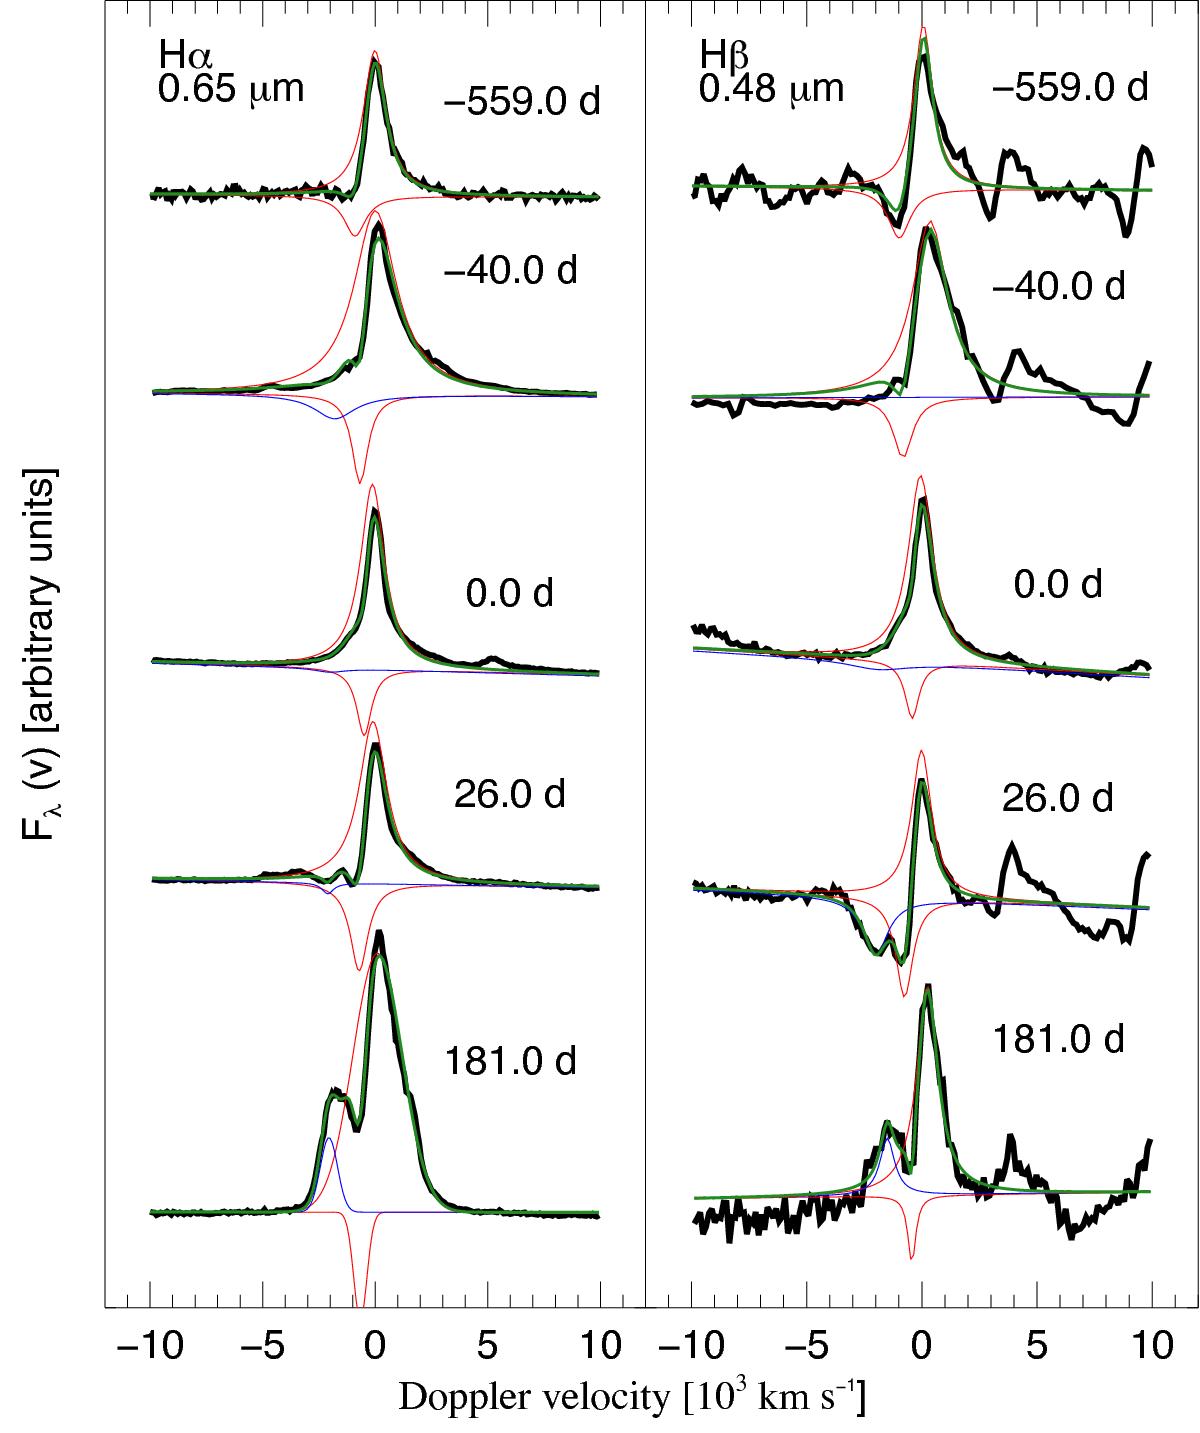
Components fitted to the Hα and Hβ line at different representative epochs. The colors of the components are identical to the ones in Fig. 10: red/orange are the narrow P Cygni profile emission and absorption components, blue/turquoise the broad components and green the total fitted profile.
Current usage metrics show cumulative count of Article Views (full-text article views including HTML views, PDF and ePub downloads, according to the available data) and Abstracts Views on Vision4Press platform.
Data correspond to usage on the plateform after 2015. The current usage metrics is available 48-96 hours after online publication and is updated daily on week days.
Initial download of the metrics may take a while.