Fig. 7
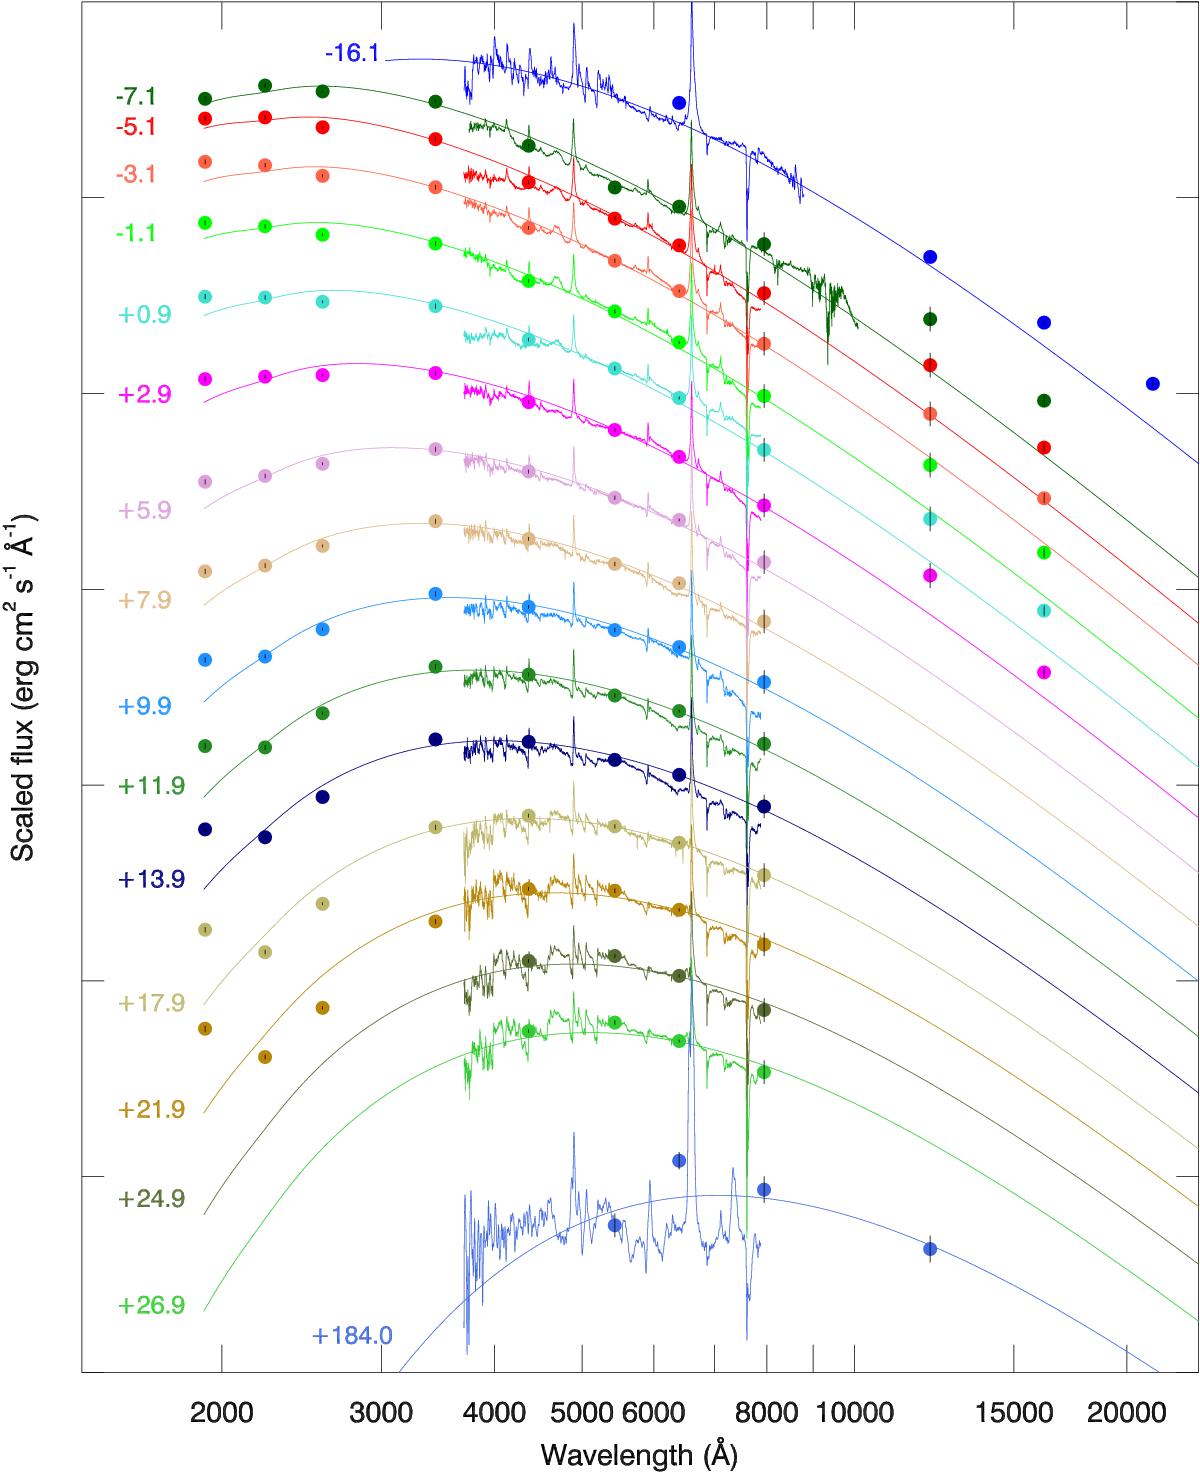
SED from UV to IR from the precursor (one epoch), during the main explosion event until 180 days post maximum. The fit shown is a simple BB fit with varying temperatures. For the VIS bands we derive magnitudes using the flux calibrated spectra. In the last spectrum/SED, the R-band is clearly affected by the strong relative Hα line flux at that time.
Current usage metrics show cumulative count of Article Views (full-text article views including HTML views, PDF and ePub downloads, according to the available data) and Abstracts Views on Vision4Press platform.
Data correspond to usage on the plateform after 2015. The current usage metrics is available 48-96 hours after online publication and is updated daily on week days.
Initial download of the metrics may take a while.