Fig. 3
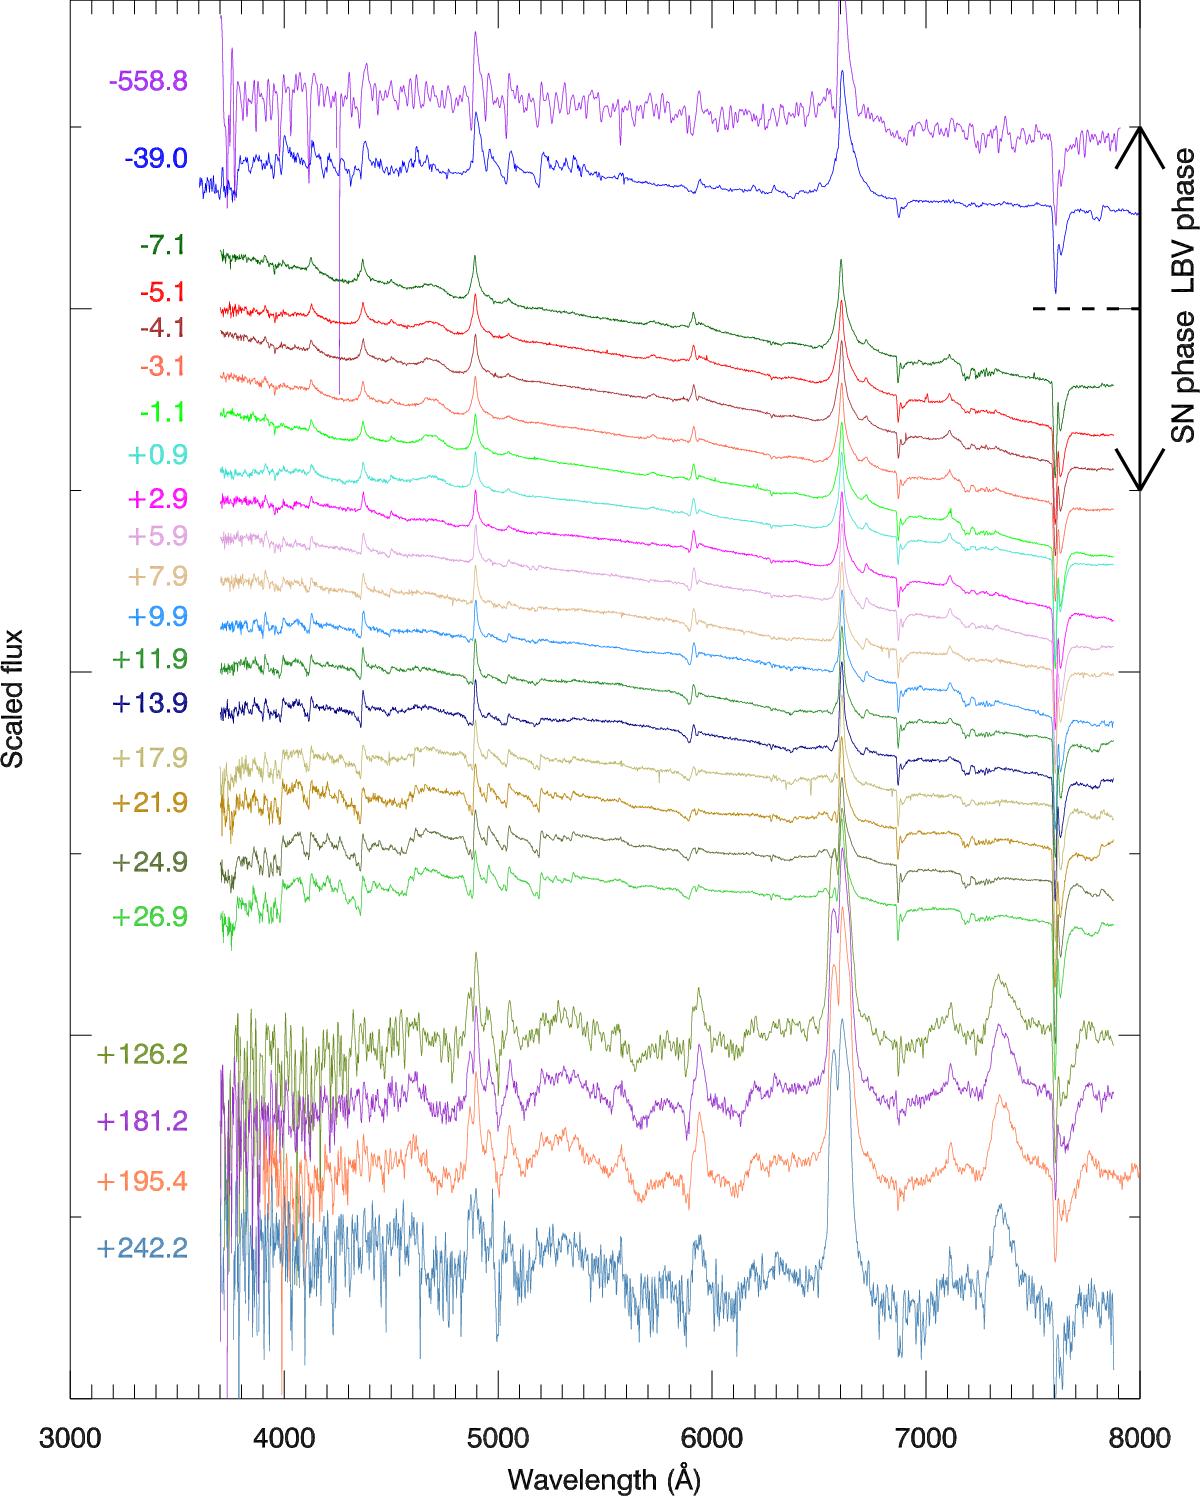
Spectroscopic evolution of the LBV and SN, including two epochs during the LBV outbursts (episode 2013, –559 d and episode 2015A at –39 d) and a closely sampled time-series during the possible SN explosion from May 16 to June 19 (–7 to +27 d). After a gap in the observations due to sun constraints we obtained four new spectra in late September (+126 d), November 2015 (+181 d), December (+195.4 d) and January 2016 (+242 d).
Current usage metrics show cumulative count of Article Views (full-text article views including HTML views, PDF and ePub downloads, according to the available data) and Abstracts Views on Vision4Press platform.
Data correspond to usage on the plateform after 2015. The current usage metrics is available 48-96 hours after online publication and is updated daily on week days.
Initial download of the metrics may take a while.