Free Access
Fig. 2
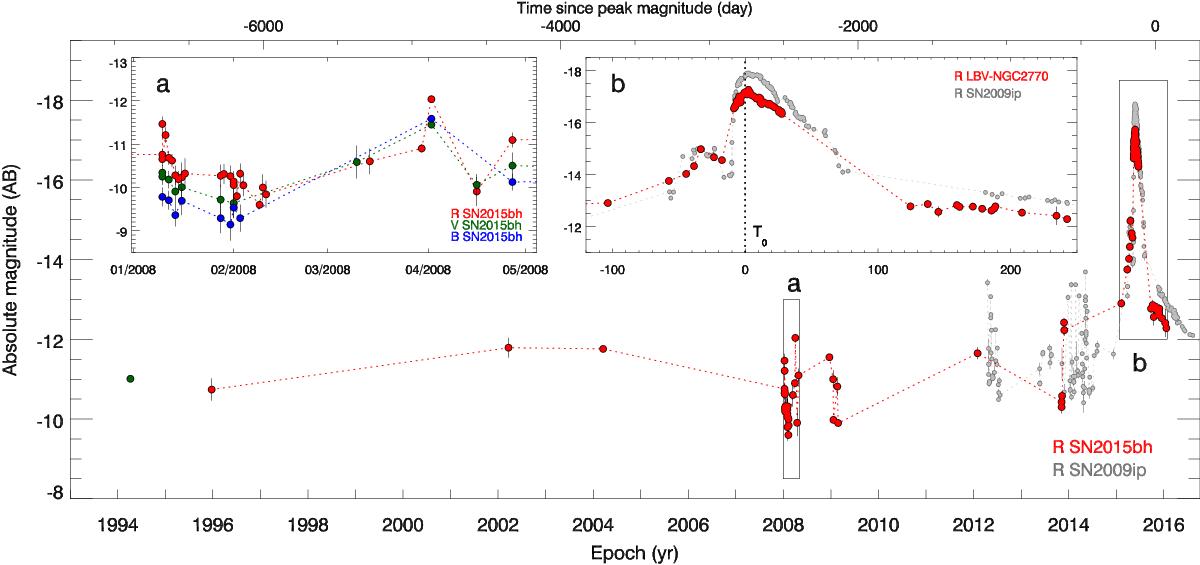
Top: light curve of the progenitor of SN 2015bh from 1994 until 2016, the insets are blow-ups of episode 2008 in different colors and episodes 2015A&B (main event and precursor). SN 2009ip is also displayed for comparison and shows a very similar behavior.
Current usage metrics show cumulative count of Article Views (full-text article views including HTML views, PDF and ePub downloads, according to the available data) and Abstracts Views on Vision4Press platform.
Data correspond to usage on the plateform after 2015. The current usage metrics is available 48-96 hours after online publication and is updated daily on week days.
Initial download of the metrics may take a while.