Fig. A.1
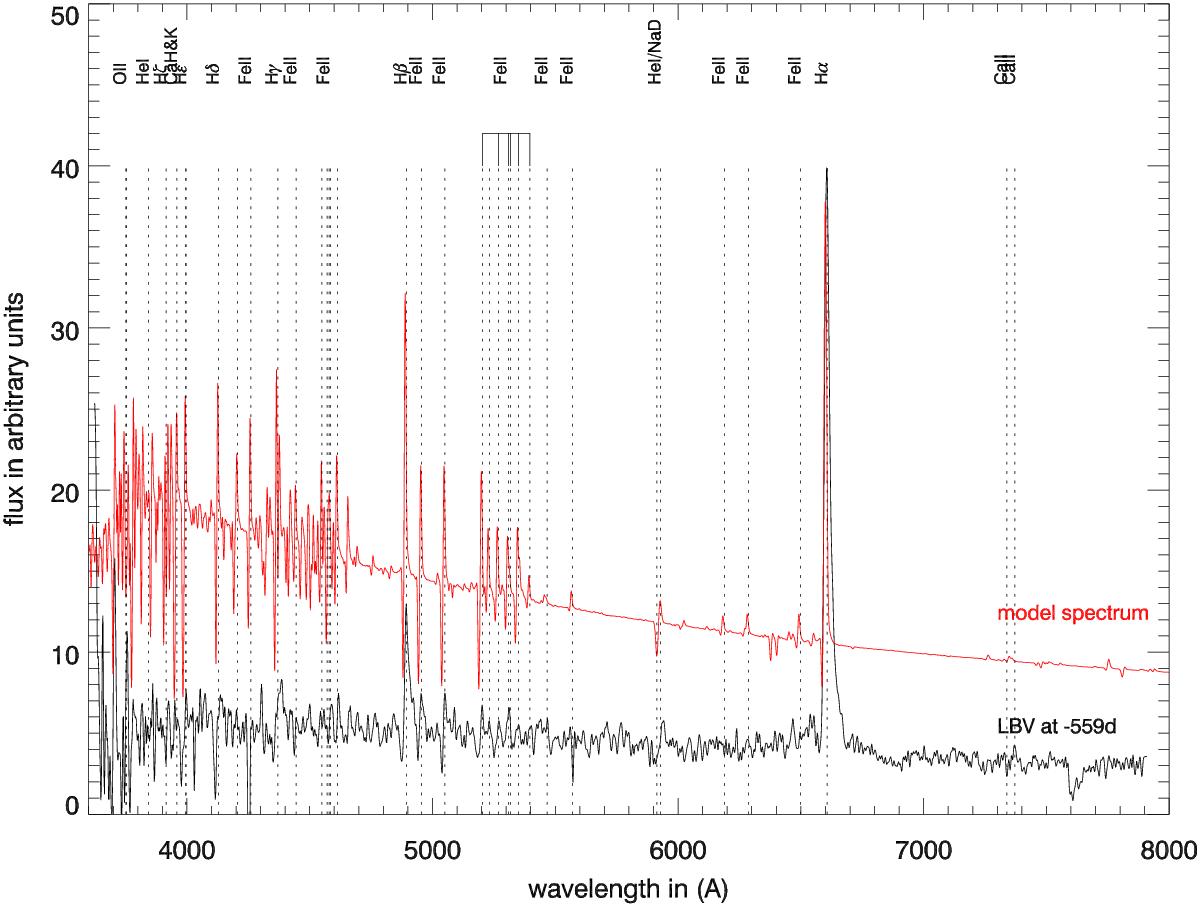
Comparsion between our Nov. 11, 2013 spectra at the onset of episode 2013A and a model spectrum of an LBV in quiescence with L = 1 × 10⁶L⊙, Teff = 8500 K, a mass loss rate of Ṁ = 5 × 10⁻⁴M⊙ yr-1 and a wind terminal speed of 600 km s-1. The model spectrum was downgraded to the resolution of the observed spectrum. The lines present are mainly Balmer lines, NaD, Ca II and Fe II.
Current usage metrics show cumulative count of Article Views (full-text article views including HTML views, PDF and ePub downloads, according to the available data) and Abstracts Views on Vision4Press platform.
Data correspond to usage on the plateform after 2015. The current usage metrics is available 48-96 hours after online publication and is updated daily on week days.
Initial download of the metrics may take a while.