Fig. 15
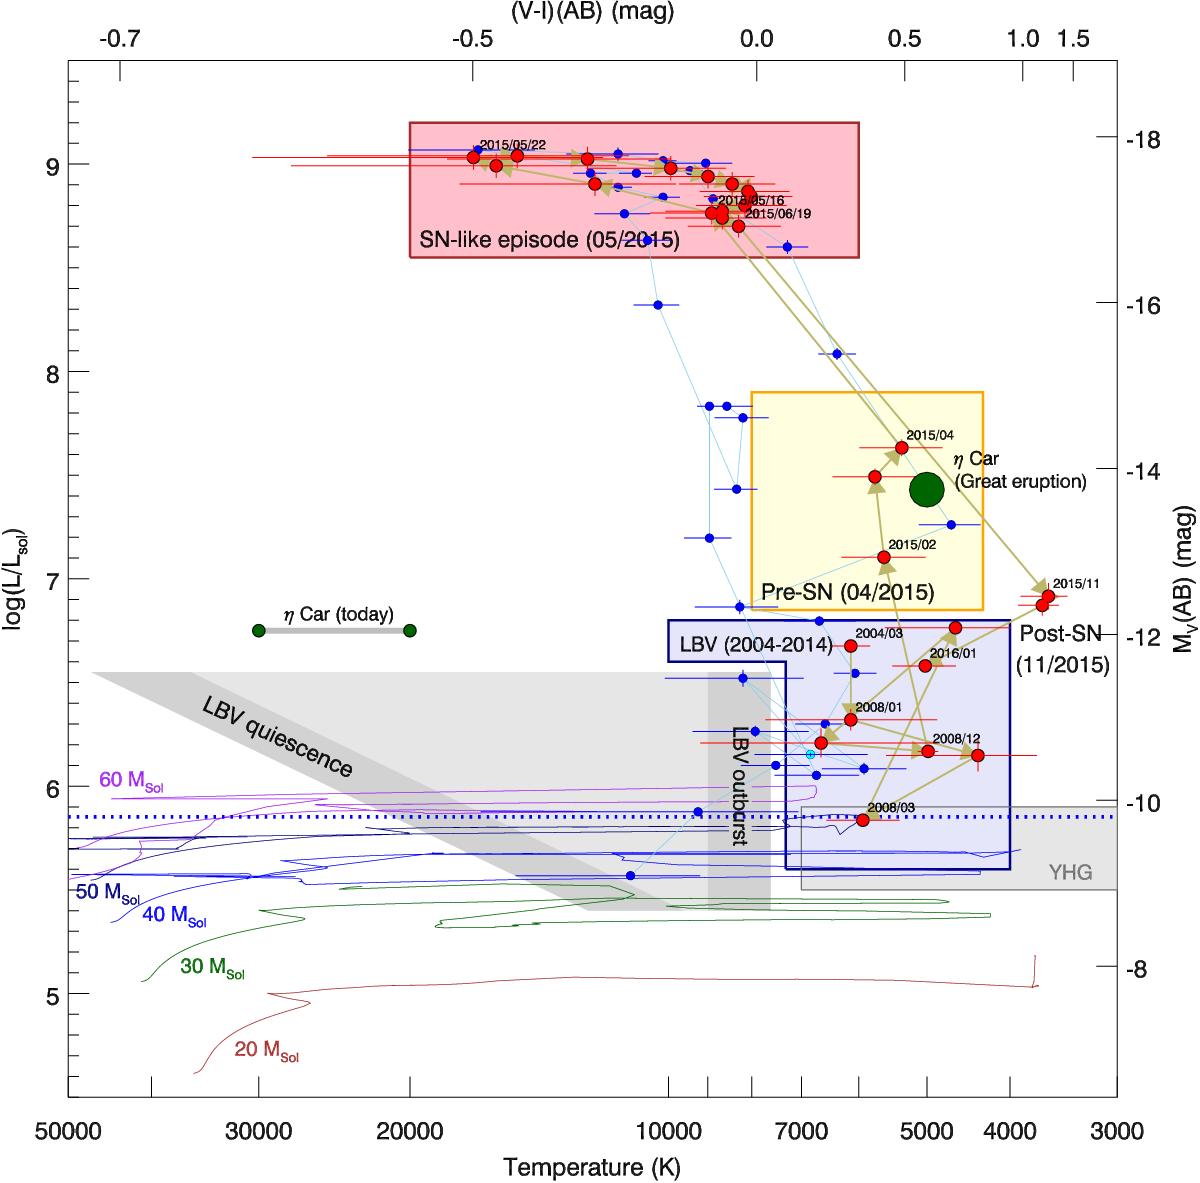
HR diagram showing the evolution of SN 2015bh during the early outbursts, throughout the precursor, main event and decline (red dots). The boxes indicate the region in which SN 2015bh was located during different phases of the evolution. Blue dots show the same for SN 2009ip from 2009 to 2015 (data from Pastorello et al. 2013; Fraser et al. 2015). The last observation at –9.1 mag (R-band) is below the proposed progenitor level from HST observations in 1999 (blue dotted line, no color information is available for this epoch). We also plot data for Eta Carinae (Rest et al. 2012) today and during the main eruption as well as the range of LBVs between quiescence and outburst.
Current usage metrics show cumulative count of Article Views (full-text article views including HTML views, PDF and ePub downloads, according to the available data) and Abstracts Views on Vision4Press platform.
Data correspond to usage on the plateform after 2015. The current usage metrics is available 48-96 hours after online publication and is updated daily on week days.
Initial download of the metrics may take a while.