Free Access
Fig. 12
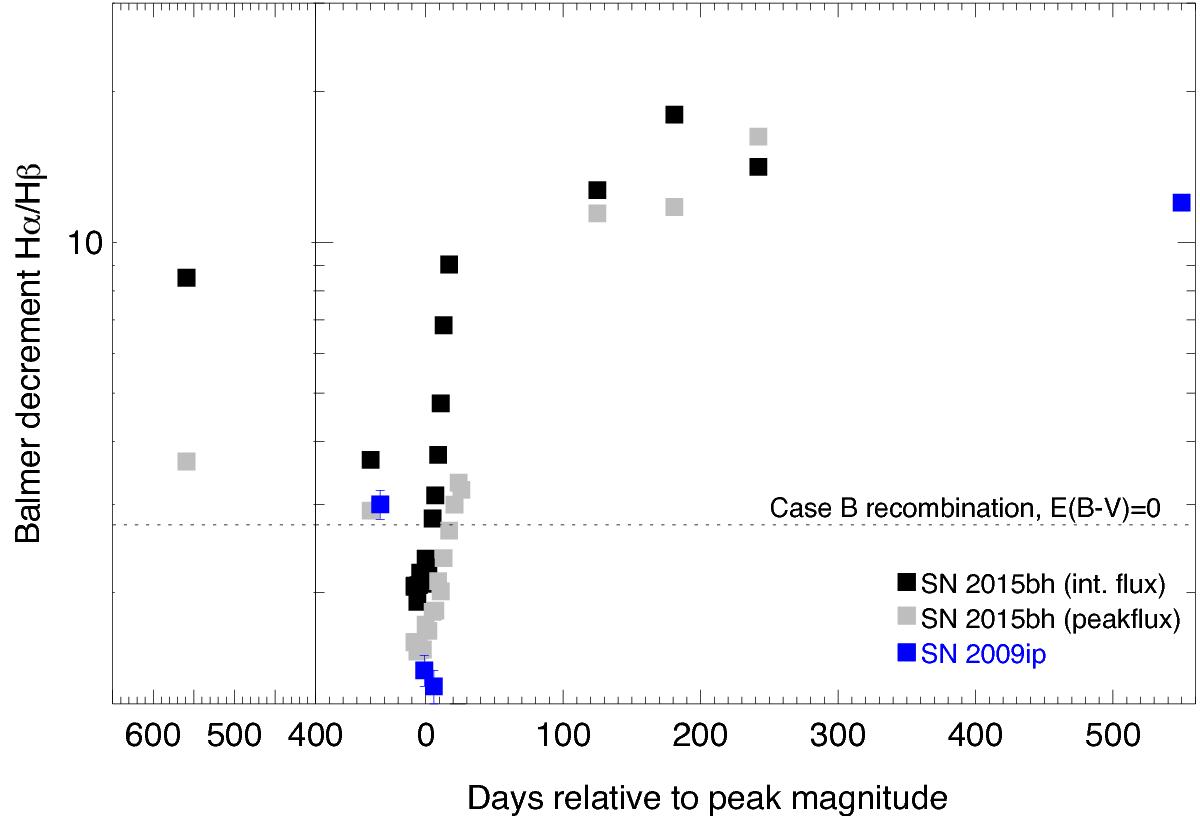
Balmer decrement evolution using total integrated and peak fluxes of Hα and Hβ and comparison with SN 2009ip (data from Levesque et al. 2014, who uses peak flux values, and Fraser et al. 2015).
Current usage metrics show cumulative count of Article Views (full-text article views including HTML views, PDF and ePub downloads, according to the available data) and Abstracts Views on Vision4Press platform.
Data correspond to usage on the plateform after 2015. The current usage metrics is available 48-96 hours after online publication and is updated daily on week days.
Initial download of the metrics may take a while.