Fig. A.1
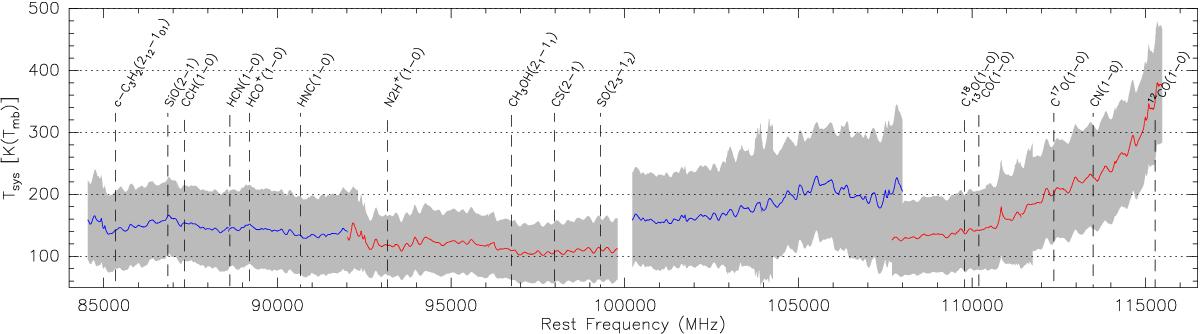
Tsys as a function of the frequency. The solid lines display the average Tsys and the gray shaded backgrounds show the ± 3σ interval at each frequency. The blue and red colors present the instantaneous 8 GHz-bandwidth of the lower and upper sidebands covered by the two tunings. The vertical dashed lines show the frequencies of the brightest lines studied here.
Current usage metrics show cumulative count of Article Views (full-text article views including HTML views, PDF and ePub downloads, according to the available data) and Abstracts Views on Vision4Press platform.
Data correspond to usage on the plateform after 2015. The current usage metrics is available 48-96 hours after online publication and is updated daily on week days.
Initial download of the metrics may take a while.