Fig. 22
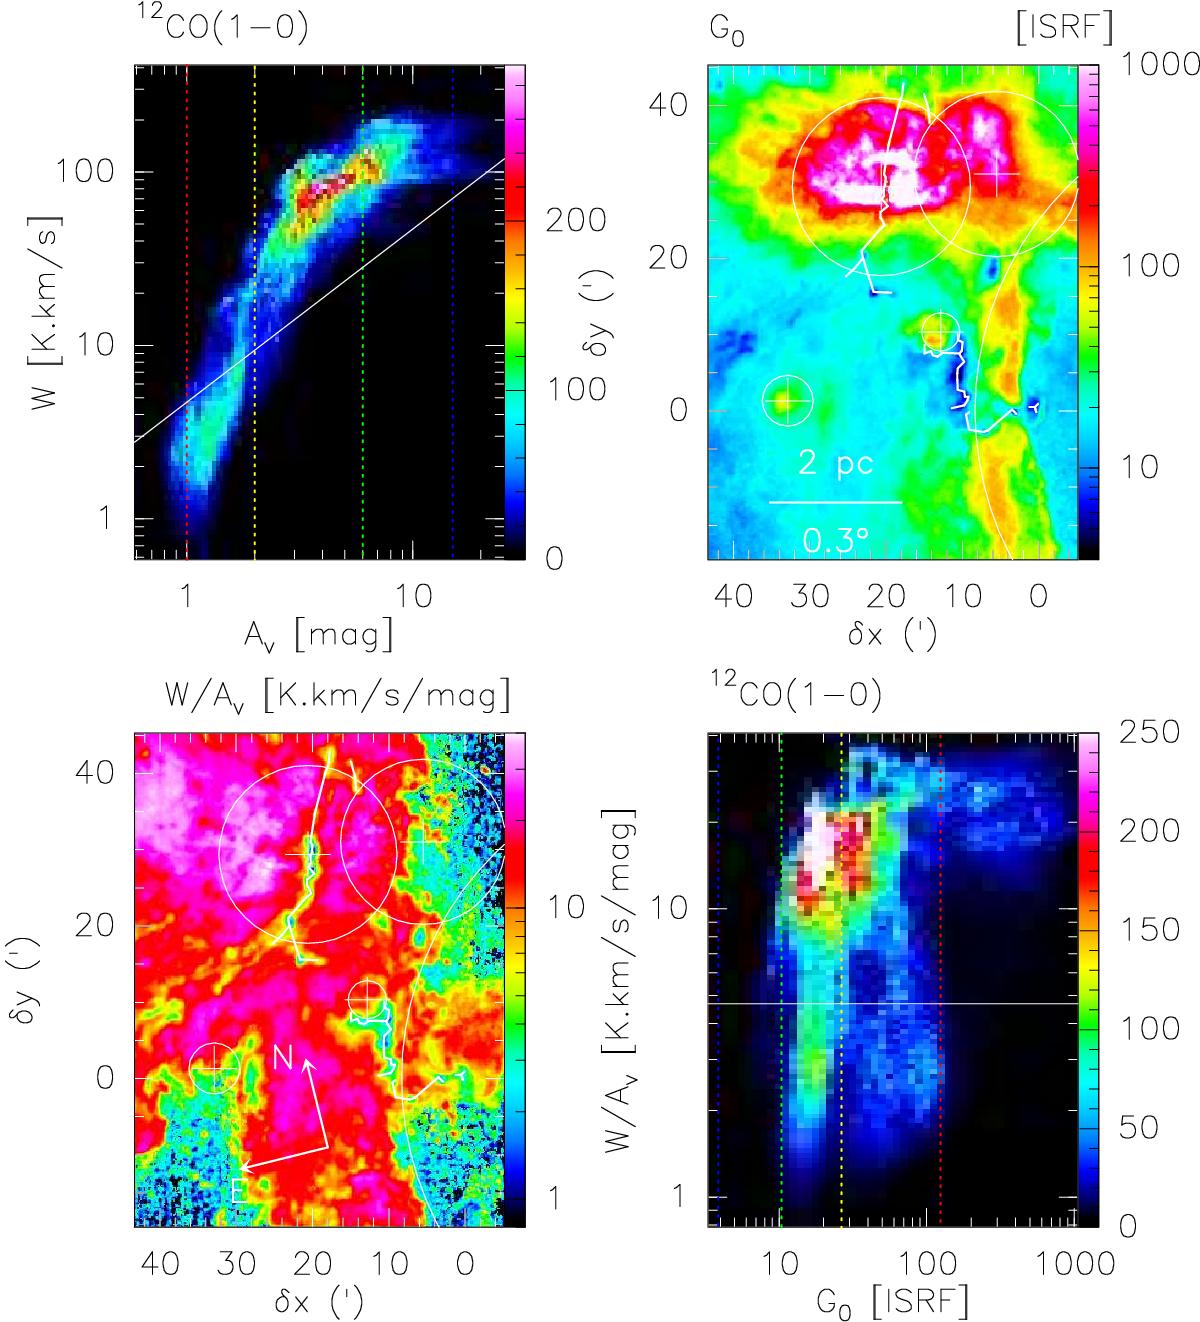
Top, left panel: joint distribution of the ![]() (1-0) line integrated intensity as a function of the visual extinction. The number of sightlines falling in a given 2D bin of the distribution is color-coded using a linear scale to emphasize the bi-modal nature of the distribution. The white line shows the location of points that follows N(H2) =XCO
(1-0) line integrated intensity as a function of the visual extinction. The number of sightlines falling in a given 2D bin of the distribution is color-coded using a linear scale to emphasize the bi-modal nature of the distribution. The white line shows the location of points that follows N(H2) =XCO ![]() . The red, orange, green, and blue vertical dashed lines show the visual extinction limits (1, 2, 6, and 15 mag, respectively) used in the masks of Fig. 6. Top, right panel: spatial distribution of the far UV illumination in units of the ISRF (Habing 1968). Bottom, left panel: ratio of the
. The red, orange, green, and blue vertical dashed lines show the visual extinction limits (1, 2, 6, and 15 mag, respectively) used in the masks of Fig. 6. Top, right panel: spatial distribution of the far UV illumination in units of the ISRF (Habing 1968). Bottom, left panel: ratio of the ![]() (1-0) line integrated intensity to the visual extinction. Bottom, right panel: joint distribution of this ratio as a function of the far UV illumination. The horizontal white line corresponds to the standard value of the XCO factor. The blue, green, orange, and red vertical dashed lines show the far UV illumination limits (4, 10, 26, and 120, respectively), which corresponds to the dust temperature limits used in the masks of Fig. 8. The color scales of the two images show the same ranges as the axes of the bottom right joint distribution.
(1-0) line integrated intensity to the visual extinction. Bottom, right panel: joint distribution of this ratio as a function of the far UV illumination. The horizontal white line corresponds to the standard value of the XCO factor. The blue, green, orange, and red vertical dashed lines show the far UV illumination limits (4, 10, 26, and 120, respectively), which corresponds to the dust temperature limits used in the masks of Fig. 8. The color scales of the two images show the same ranges as the axes of the bottom right joint distribution.
Current usage metrics show cumulative count of Article Views (full-text article views including HTML views, PDF and ePub downloads, according to the available data) and Abstracts Views on Vision4Press platform.
Data correspond to usage on the plateform after 2015. The current usage metrics is available 48-96 hours after online publication and is updated daily on week days.
Initial download of the metrics may take a while.