Fig. 2
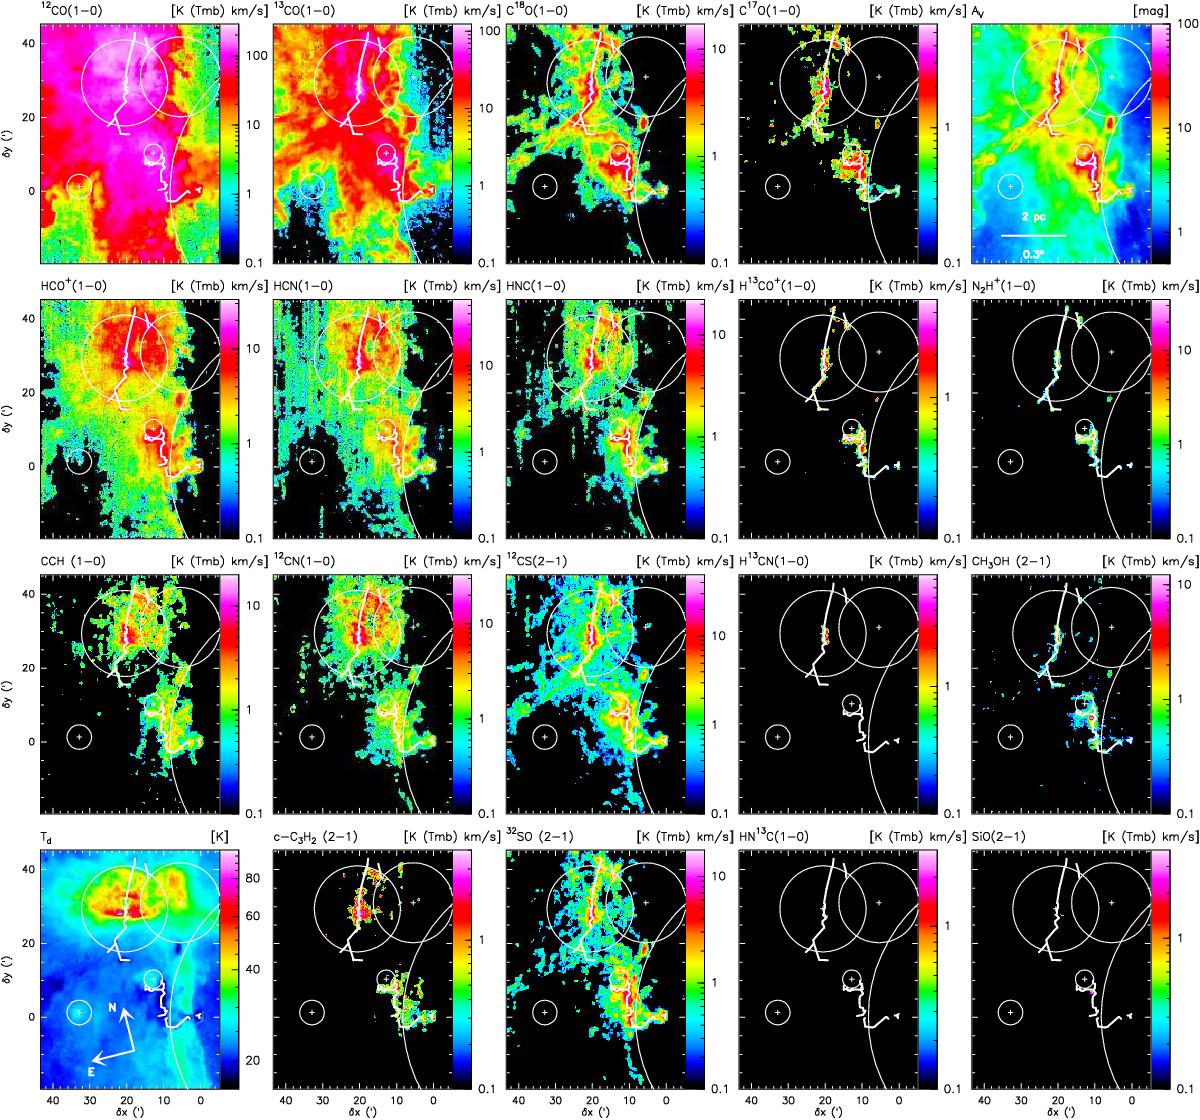
Spatial distribution of the line integrated intensity for some of the detected lines in the 3 mm band, plus the dust temperature (bottom left panel) and the visual extinction (top right corner). Continuum data comes from the publicly available SED fit done by Lombardi et al. (2014) on the Herschel Gould Belt Survey data (PI: P. André). The color-scales are logarithmic to reveal the distribution of faint signal. Pixels with a signal-to-noise lower than four were blanked out. In addition to the circles and crosses that show the approximate boundaries of the H ii regions and the associated exciting stars, we overlaid broken lines that were somewhat arbitrarily drawn by connecting the N2H+ (1-0) emission.
Current usage metrics show cumulative count of Article Views (full-text article views including HTML views, PDF and ePub downloads, according to the available data) and Abstracts Views on Vision4Press platform.
Data correspond to usage on the plateform after 2015. The current usage metrics is available 48-96 hours after online publication and is updated daily on week days.
Initial download of the metrics may take a while.