Fig. 14
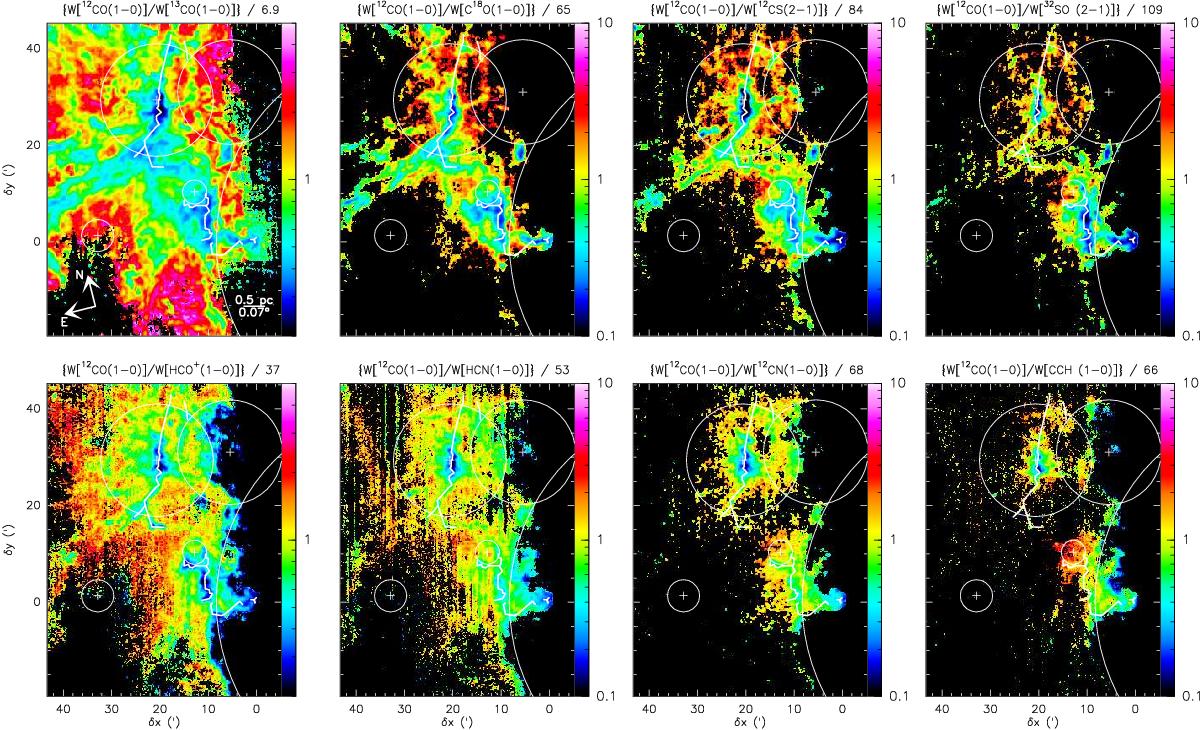
Spatial distribution of the ratios of line intensity integrated over [9,12 km s-1]. The ratios are normalized by the median value of the ratio. The numerator is always W{13CO(1−0)}. The color scale shows ratio values between 0.1 and 10 for all the ratio panels, except the ![]() /
/![]() and
and ![]() /HCO+ panels where the color scale goes from 0.2 to 5.
/HCO+ panels where the color scale goes from 0.2 to 5.
Current usage metrics show cumulative count of Article Views (full-text article views including HTML views, PDF and ePub downloads, according to the available data) and Abstracts Views on Vision4Press platform.
Data correspond to usage on the plateform after 2015. The current usage metrics is available 48-96 hours after online publication and is updated daily on week days.
Initial download of the metrics may take a while.