Fig. 11
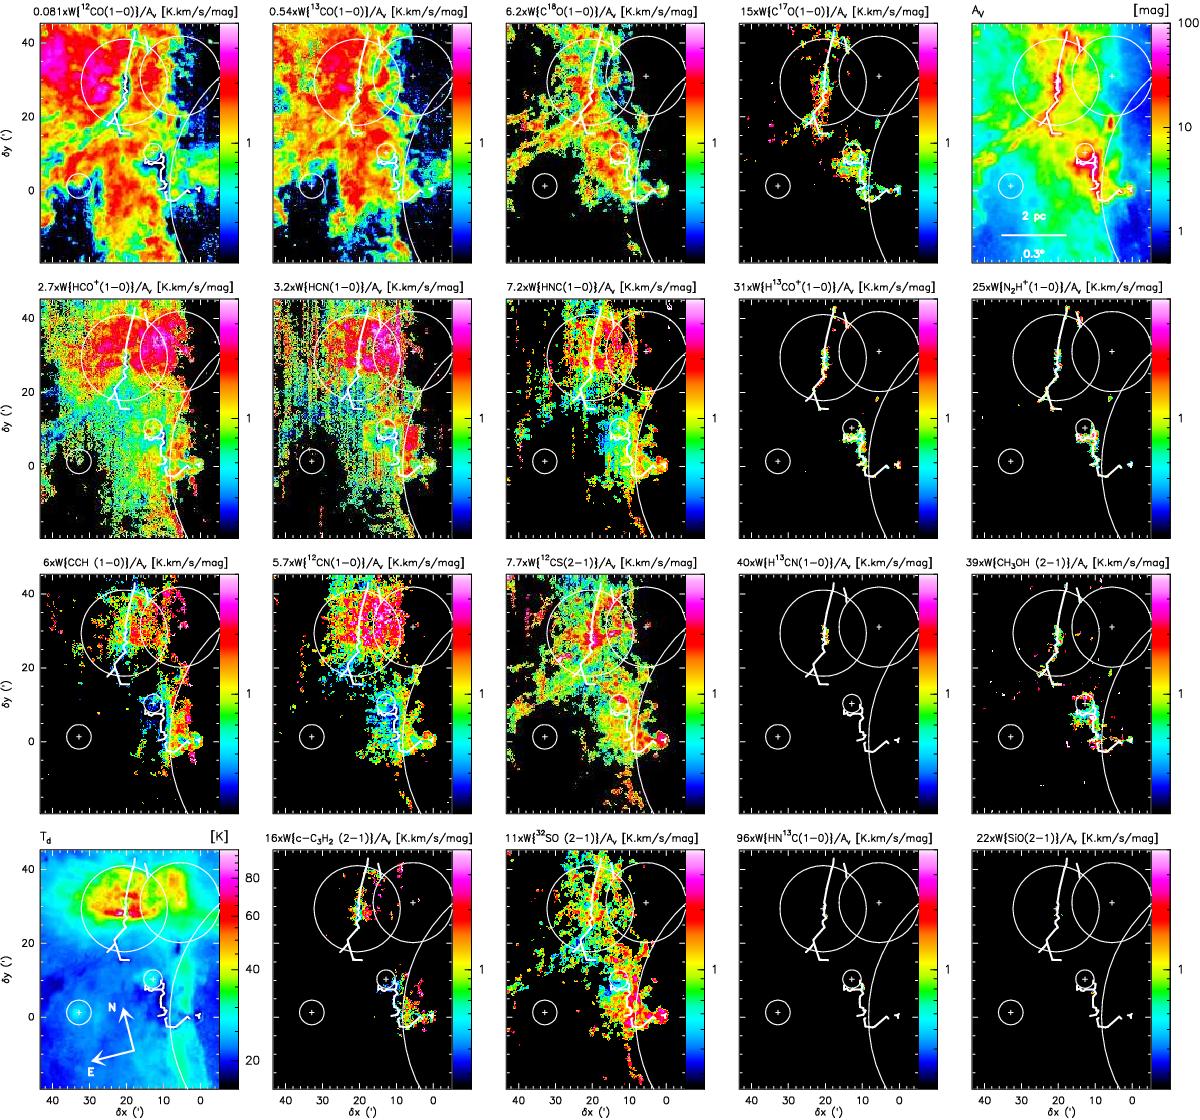
Spatial distribution of the ratio of the line integrated intensity to the visual extinction for some of the detected lines in the 3mm band, plus the dust temperature (bottom left panel) and the visual extinction (top right corner). The ratios are normalized by their median value that hence appears as 1 on the color look-up table. The color scale shows ratio values between 0.25 and 4 times the median value for all the ratio panels.
Current usage metrics show cumulative count of Article Views (full-text article views including HTML views, PDF and ePub downloads, according to the available data) and Abstracts Views on Vision4Press platform.
Data correspond to usage on the plateform after 2015. The current usage metrics is available 48-96 hours after online publication and is updated daily on week days.
Initial download of the metrics may take a while.