Fig. 10
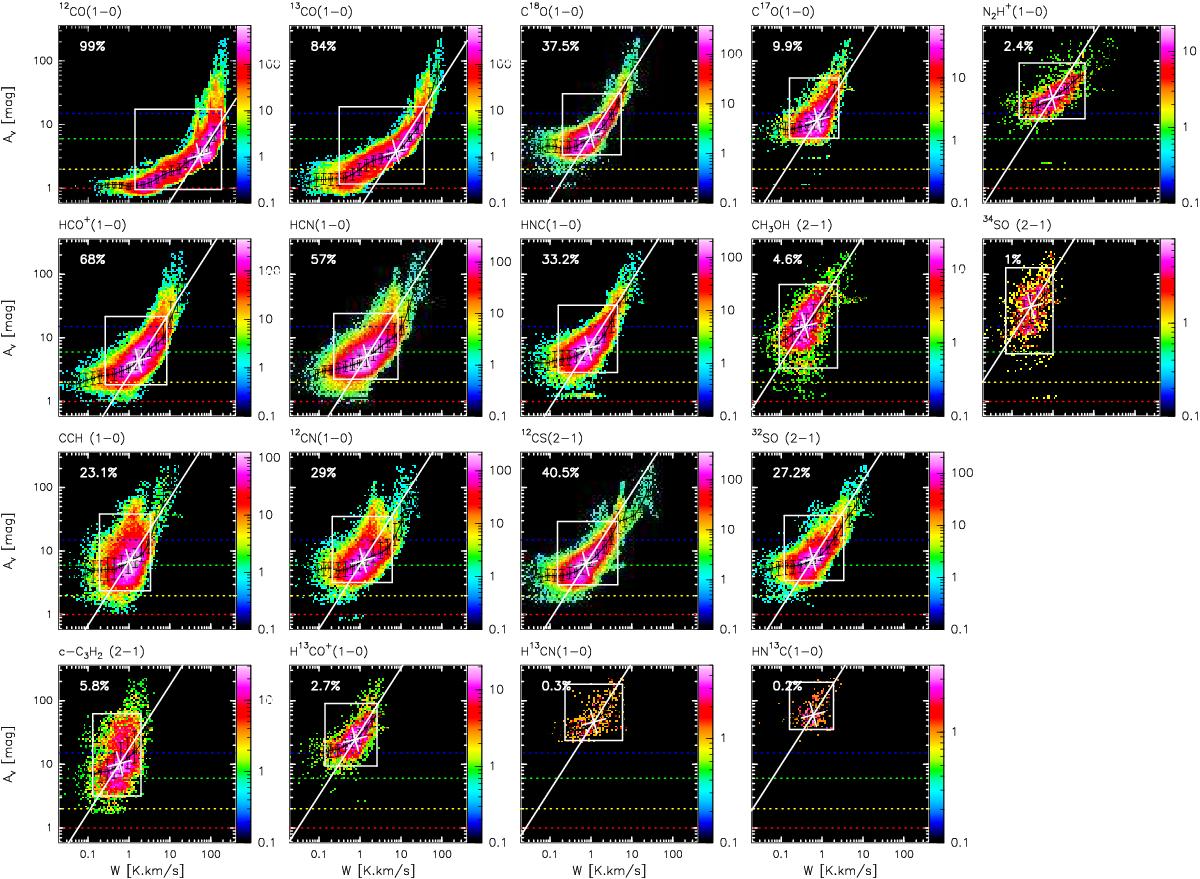
Joint distributions of the visual extinction as a function of the line integrated intensity for a selection of the detected lines. The percentage in the top left corner indicates the surface over which the joint distributions can be reliably computed. These distributions contain both the global trend for the bulk of the gas and extreme behavior at low and high visual extinctions. The number of sightlines falling in a given 2D bin of the distribution is color-coded using a logarithmic scale to emphasize the extreme behavior (in particular the dense cores) that occupies a small fraction of the observed field of view. In contrast, the white rectangle displays the region of the distribution where 90% of the points are located: 2.5% of the points are outside this rectangle on each side. This allows us to define more robust global trends for the bulk of the gas. The white point shows the median of the two marginalized distributions. A line of unit slope, that is, a linear relationship between visual extinction and the line integrated intensities, is overlaid as the white plain line going through the white cross. The black points show the median values of all data points falling in a regularly sampled interval of the logarithm of the line integrated intensity. The black error bars show the range of values where 50% of the points in the current bin are located. This allows us to ask whether molecular lines are good tracers of the visual extinction. All these parameters are listed in Table 8. The red, orange, green, and blue horizontal dashed lines show the visual extinction limits (1, 2, 6, and 15 mag, respectively) used in the masks of Fig. 6. This enables us to visualize the amount of well detected pixels that falls in each of the masks for each line.
Current usage metrics show cumulative count of Article Views (full-text article views including HTML views, PDF and ePub downloads, according to the available data) and Abstracts Views on Vision4Press platform.
Data correspond to usage on the plateform after 2015. The current usage metrics is available 48-96 hours after online publication and is updated daily on week days.
Initial download of the metrics may take a while.