Fig. 8
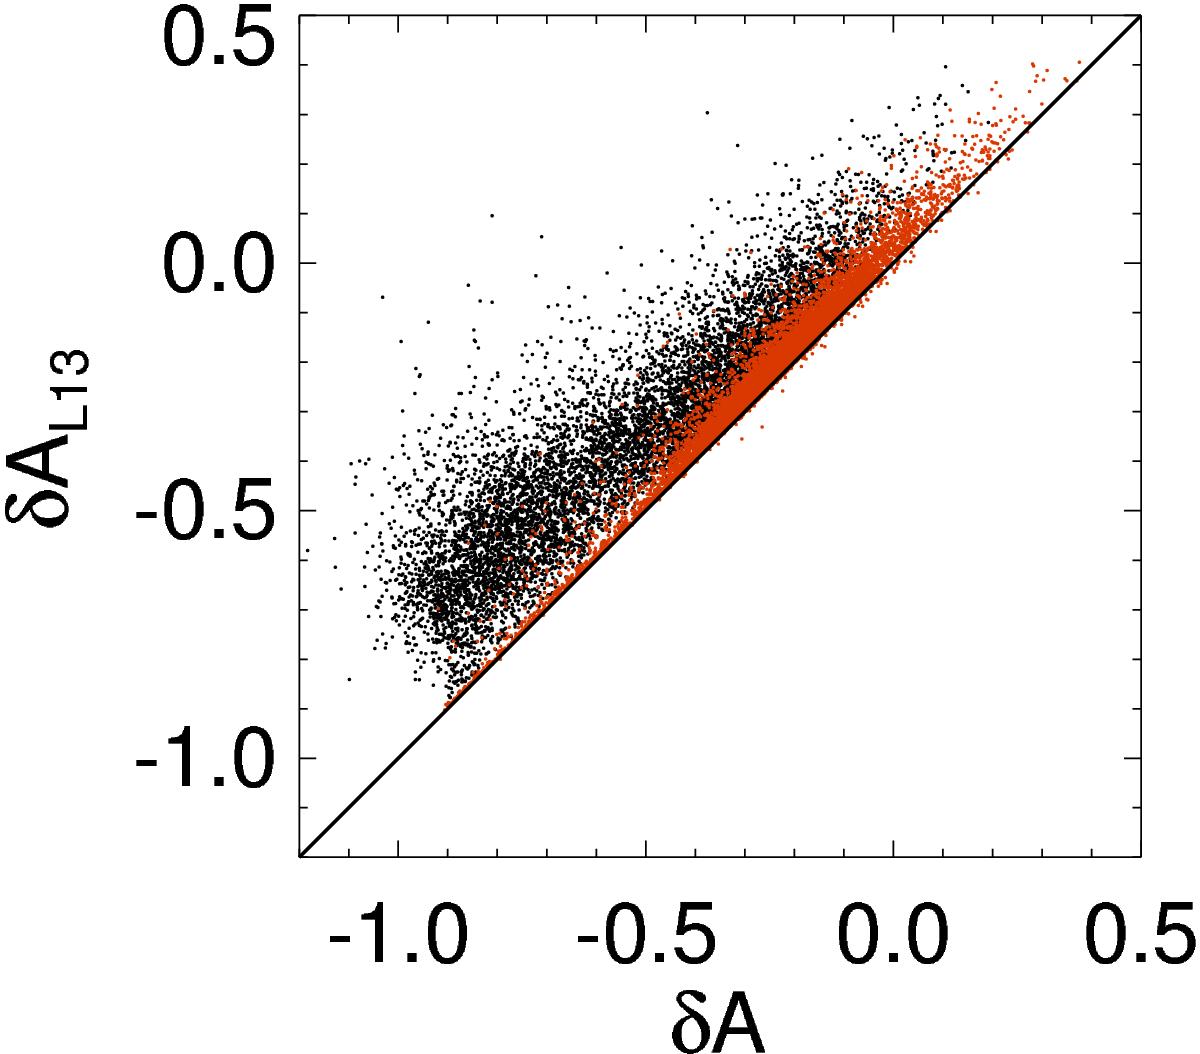
Scatter plot of amplitudes for the p1 cross-covariance functions. The data points in the field of the view of the p1 panels of Fig. 6 are used for this plot; the Pearson correlation coefficient is 0.91. The red points are the points in the area where | δτL13 | < 20 s. The Pearson correlation coefficient for these red data points is 0.98.
Current usage metrics show cumulative count of Article Views (full-text article views including HTML views, PDF and ePub downloads, according to the available data) and Abstracts Views on Vision4Press platform.
Data correspond to usage on the plateform after 2015. The current usage metrics is available 48-96 hours after online publication and is updated daily on week days.
Initial download of the metrics may take a while.