Fig. 7
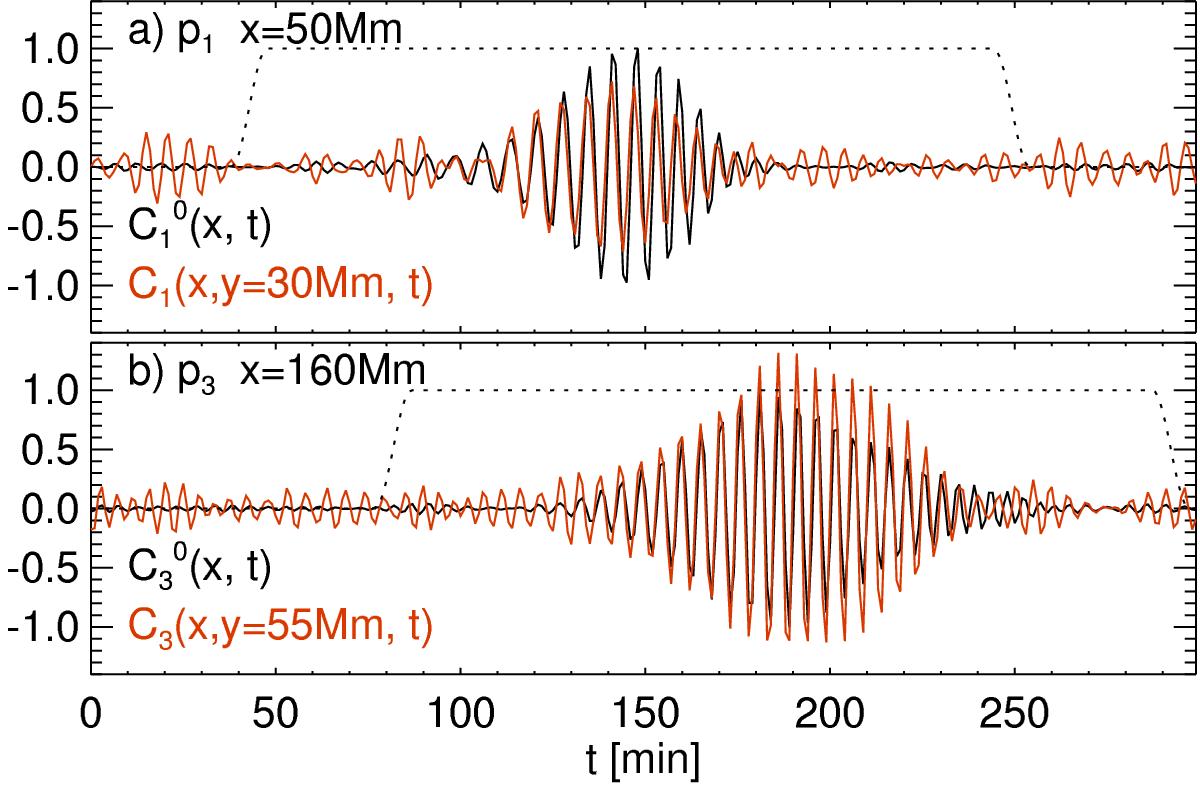
Example cross-covariance functions used in Liang et al. (2013). Panels a) and b) are p1 cross-covariances at (x,y) = (50 Mm,30 Mm) and p3 cross-covariances at (x,y) = (160 Mm,55 Mm), respectively (see the squares drawn in Fig. 6). In each panel ![]() is drawn in a black solid line, and Cn(x,y,t) is shown with a red line and normalized by the maximum of the absolute value of
is drawn in a black solid line, and Cn(x,y,t) is shown with a red line and normalized by the maximum of the absolute value of ![]() . The dotted lines are the window functions. The amplitudes for the cross-covariance in panel a) are δA = −0.45 and δAL13 = −0.28, while for panel b) δA = 0.19 and δAL13 = 0.25.
. The dotted lines are the window functions. The amplitudes for the cross-covariance in panel a) are δA = −0.45 and δAL13 = −0.28, while for panel b) δA = 0.19 and δAL13 = 0.25.
Current usage metrics show cumulative count of Article Views (full-text article views including HTML views, PDF and ePub downloads, according to the available data) and Abstracts Views on Vision4Press platform.
Data correspond to usage on the plateform after 2015. The current usage metrics is available 48-96 hours after online publication and is updated daily on week days.
Initial download of the metrics may take a while.