Fig. 6
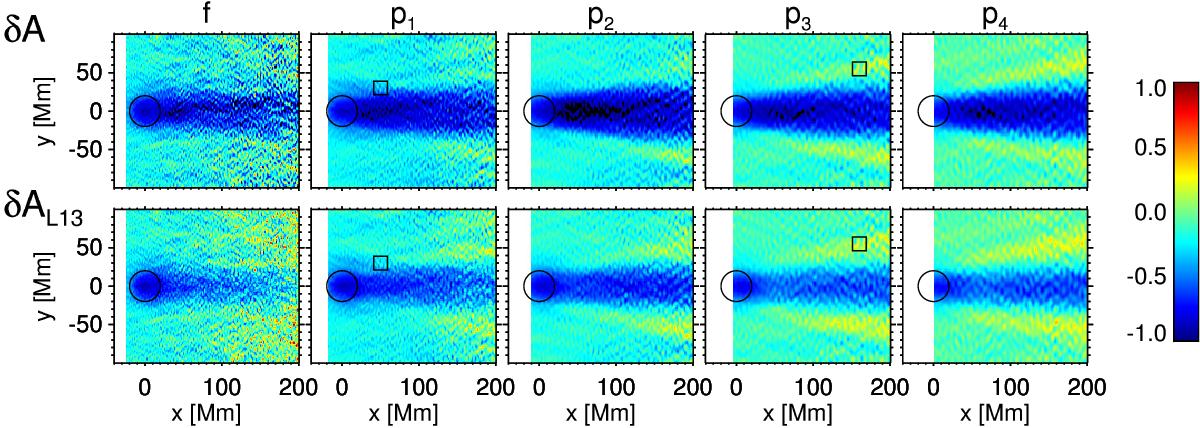
Observed amplitude perturbations around the sunspot NOAA 9787 with respect to the quiet Sun using SOHO/MDI observation. From left to right the results for f, p1, p2, p3, and p4 modes are shown. The black circle shows the outer boundary of the penumbra. The upper panels show the linear amplitude, δA, while the lower panels are replots of Fig. 2 of Liang et al. (2013); for better comparison, here we show δAL13 = AL13−1 instead of AL13 as in Fig. 2 of Liang et al. (2013). The central points of the squares in p1 and p3 panels are the positions of the cross-covariance functions shown in Fig. 7. The measurement results in the near field are not shown in the plots; the near field is defined as x−x0< 3λ, where λ is the typical wavelength for each mode, and x0 = −43.73 Mm is the leftmost point of these plots over which ⟨ φn ⟩ in Eq. (18) is averaged (see Table 1 in Liang et al. 2013 for details).
Current usage metrics show cumulative count of Article Views (full-text article views including HTML views, PDF and ePub downloads, according to the available data) and Abstracts Views on Vision4Press platform.
Data correspond to usage on the plateform after 2015. The current usage metrics is available 48-96 hours after online publication and is updated daily on week days.
Initial download of the metrics may take a while.