Free Access
Fig. 4
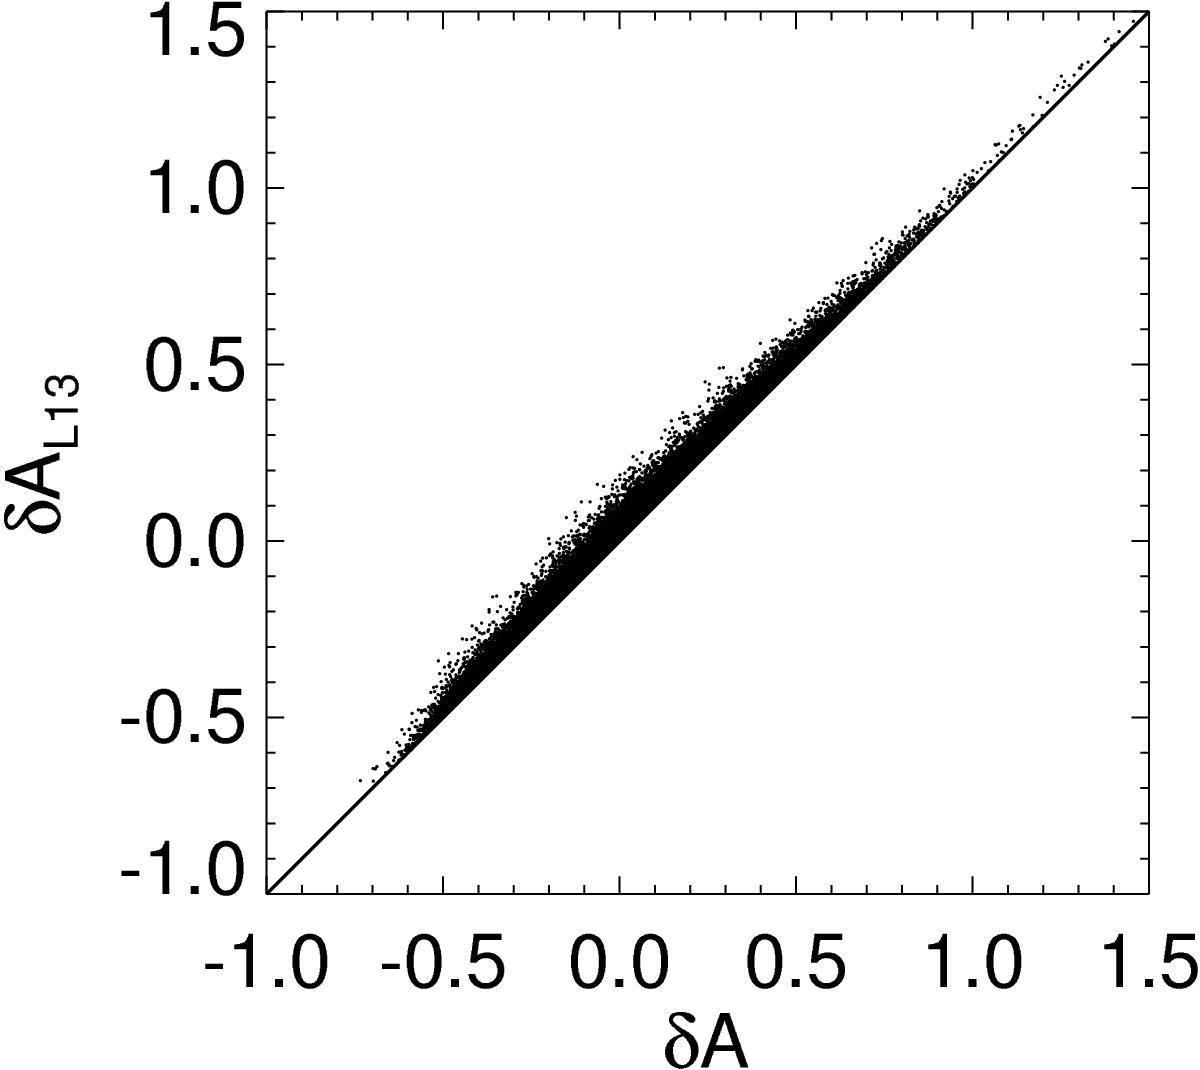
Scatter plot between the linear definition of the amplitude δA and δAL13 for the case of a (quiet-Sun) realization noise calculation. These two amplitude measurements show a good correlation; the Pearson correlation coefficient is 0.996. This plot also shows δAL13 ≥ δA, which is expected from Eq. (17).
Current usage metrics show cumulative count of Article Views (full-text article views including HTML views, PDF and ePub downloads, according to the available data) and Abstracts Views on Vision4Press platform.
Data correspond to usage on the plateform after 2015. The current usage metrics is available 48-96 hours after online publication and is updated daily on week days.
Initial download of the metrics may take a while.