Fig. 3
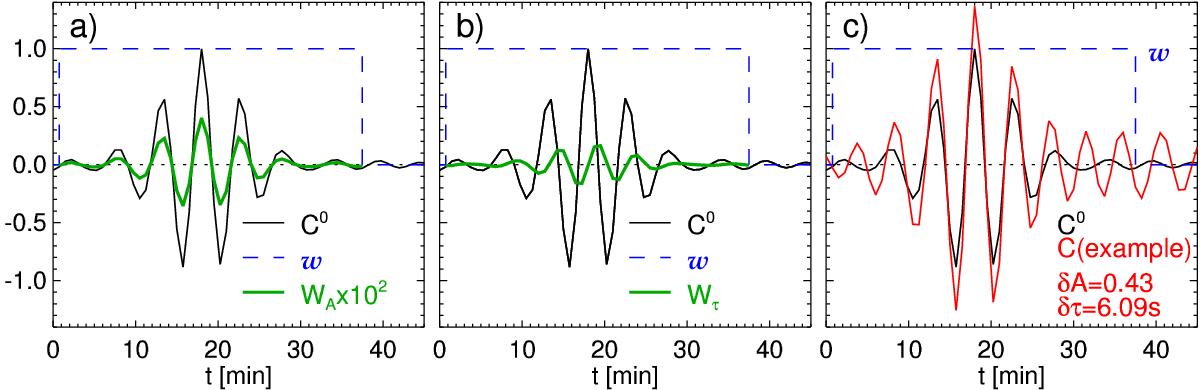
p1-mode cross-covariance functions (thin solid lines) and the weight functions (thick solid lines) calculated from a solar noise model datacube (Langfellner et al. 2015) and the window functions (dashed lines) w(t) to select the p1-mode wave packet. Panel a): the cross-covariance function averaged over the field of view as the reference cross-covariance function, C0, and the weight function for amplitude WA. Panel b): similar to a) but with the weight function for travel time Wτ. Panel c): one example cross-covariance function (at the central point of the field of view) and C0. The measured amplitude and travel time for this example cross-covariance are written in the panel. The cross-covariance functions in these plots are normalized by the maximum of the absolute value of C0. The cross-covariance functions and Wτ are dimensionless; the weight functions are calculated using the normalized cross-covariance and choosing seconds as the unit of time. In the figure, WA is multiplied by 102 for visibility and the units are s-1.
Current usage metrics show cumulative count of Article Views (full-text article views including HTML views, PDF and ePub downloads, according to the available data) and Abstracts Views on Vision4Press platform.
Data correspond to usage on the plateform after 2015. The current usage metrics is available 48-96 hours after online publication and is updated daily on week days.
Initial download of the metrics may take a while.