Fig. 1
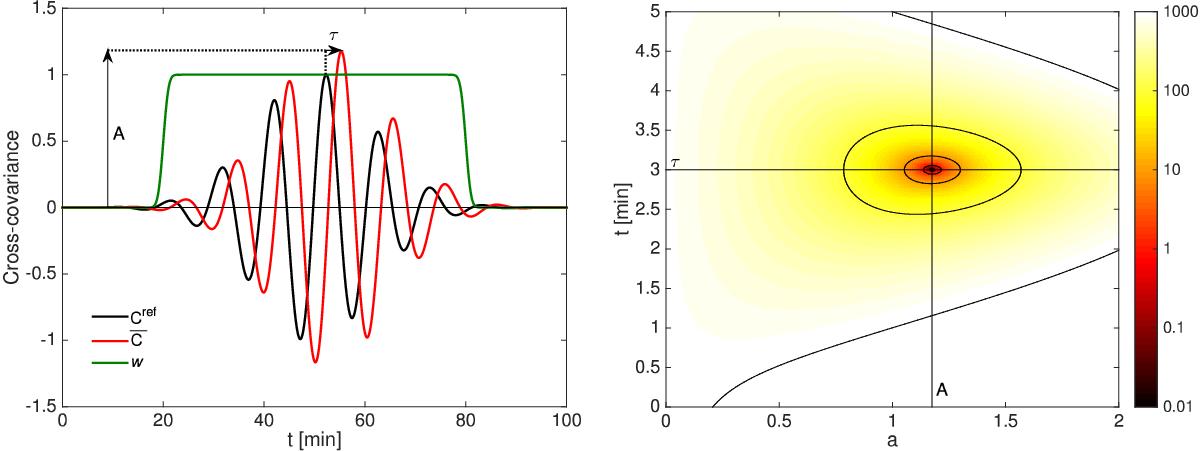
Left: illustrative sketch of a perturbed and reference cross-covariances (![]() and Cref, respectively) and the window function w. Right: the associated cost function X(a,t) in log-scale color with contours where X = 0.1, 1, 10, 100, and 1000. The color scale gives the value of the misfit. To measure τ and A, we need to minimize X, and in this case the minimum is reached for τ = 3 min and A = 1.2. In this plot (left panel) we show only t> 0. This part of the cross-covariance function corresponds to waves propagating from the position x1 to x2, and the window function for this wave is zero for t< 0.
and Cref, respectively) and the window function w. Right: the associated cost function X(a,t) in log-scale color with contours where X = 0.1, 1, 10, 100, and 1000. The color scale gives the value of the misfit. To measure τ and A, we need to minimize X, and in this case the minimum is reached for τ = 3 min and A = 1.2. In this plot (left panel) we show only t> 0. This part of the cross-covariance function corresponds to waves propagating from the position x1 to x2, and the window function for this wave is zero for t< 0.
Current usage metrics show cumulative count of Article Views (full-text article views including HTML views, PDF and ePub downloads, according to the available data) and Abstracts Views on Vision4Press platform.
Data correspond to usage on the plateform after 2015. The current usage metrics is available 48-96 hours after online publication and is updated daily on week days.
Initial download of the metrics may take a while.